Figures & data
Figure 1 Physicochemical characterization of curcumin-loaded magnetic nanoparticle formulation. (A) Hypothetical schematic representation of curcumin-loaded single magnetic nanoparticle formulation. (B) Transmission electron microscopic image of curcumin-loaded magnetic nanoparticle formulation. Data show an individual particle grain size of ~9 nm. (C) Dynamic light scattering measurement of curcumin-loaded magnetic nanoparticle formulation. Data demonstrates the average nanoparticle aggregative size is 123 nm. Data represents the average of three replicates. (D) Fourier transform infrared spectra of magnetic nanoparticle formulation, curcumin, and curcumin-loaded magnetic nanoparticle formulation. Data was obtained for dry powder samples. (E) In vitro curcumin release from curcumin-loaded magnetic nanoparticle formulation. Inset tubes depict curcumin release at different time points (0.4–28 days). Data represents the mean ± standard error of the mean for three repeats.
Abbreviations: CUR, curcumin; MNP, magnetic nanoparticle formulation; MNP-CUR, curcumin-loaded magnetic nanoparticle formulation; NP, nanoparticle.
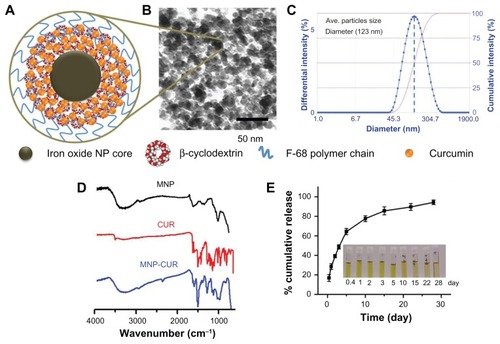
Figure 2 Curcumin-loaded magnetic nanoparticle formulation improves curcumin cellular uptake. (A) Phase contrast images of MDA-MB-231 cancer cells treated with curcumin-loaded magnetic nanoparticle formulation (0–30 μM). The intensity of blue stain produced by Prussian blue from the iron of curcumin-loaded magnetic nanoparticle formulation helps improve visualization of internalized nanoparticles of curcumin-loaded magnetic nanoparticle formulation. White arrows highlight less internalization of nanoparticles and red arrows indicate greater accumulation of nanoparticles. (B) Transmission electron microscopic images of free MDA-MB-231 cells and MDA-MB-231 cells incubated with curcumin-loaded magnetic nanoparticle formulation (20 μM) for 6 hours. Black arrows indicate the accumulation and internalized nanoparticles (curcumin-loaded magnetic nanoparticle formulation) and red arrows represent the vacuole and lysosomal activity which induces apoptosis.
Abbreviations: MNP-CUR, curcumin-loaded magnetic nanoparticle formulation; N, nucleus.
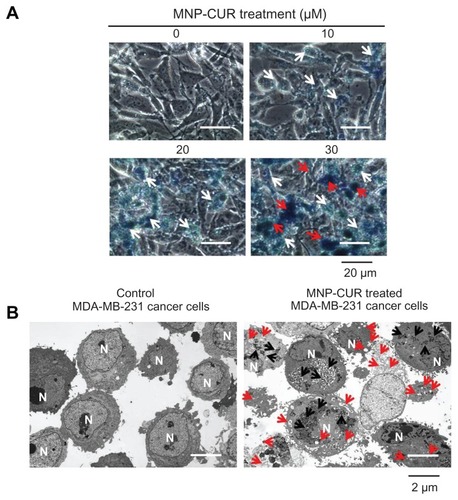
Figure 3 Curcumin-loaded magnetic nanoparticle formulation particle size is not influenced by human and mouse serum protein adsorption. (A) Curcumin-loaded magnetic nanoparticle formulation particles morphology viewed under transmission electron microscope before and after incubation with human and mouse serum. (B) Particle size of curcumin-loaded magnetic nanoparticle formulation before and after incubation with human and mouse serum.
Abbreviation: MNP-CUR, curcumin-loaded magnetic nanoparticle formulation.
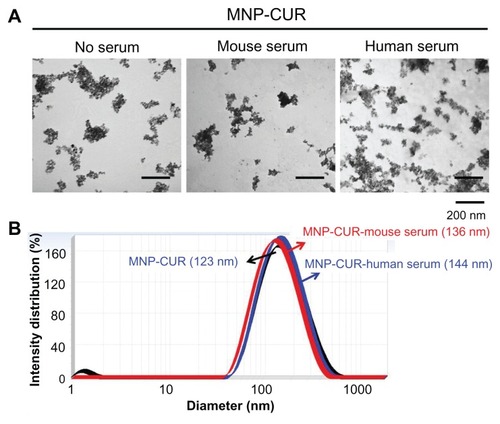
Figure 4 Curcumin-loaded magnetic nanoparticle formulation treatment increases the anticancer potential in MDA-MB-231 cells. (A and B) Cells were treated with different concentrations (5–40 μM) of curcumin or curcumin-loaded magnetic nanoparticle formulation; medium was changed on day two. (A) Representative phase contrast images of MDA-MB-231 cells treated with vehicle (dimethyl sulfoxide or magnetic nanoparticles) and 10–30 μM curcumin or 10–30 μM curcumin-loaded magnetic nanoparticle formulation. Images obtained at 2000×. (B) Cell viability was measured using methyl tetrazolium salt assay using an ultraviolet-visible spectrophotometer at 492 nm. Data is mean ± standard error of the mean (n = 6). Dimethyl sulfoxide and magnetic nanoparticle formulation controls did not show any effect at these concentrations. (C and D) Cells were treated with either 4–8 μM of curcumin or curcumin-loaded magnetic nanoparticle formulation for 10 days. (C) Representative images of colonies stained with hematoxylin. (D) Colony density was counted and expressed as a percent of the control. Data represent mean of triplicate for each treatment (mean ± standard error of the mean). *P < 0.05 for significance difference.
Abbreviations: CUR, curcumin; DMSO, dimethyl sulfoxide; MNP, magnetic nanoparticle formulation; MNP-CUR, curcumin-loaded magnetic nanoparticle formulation; NPs, nanoparticles.
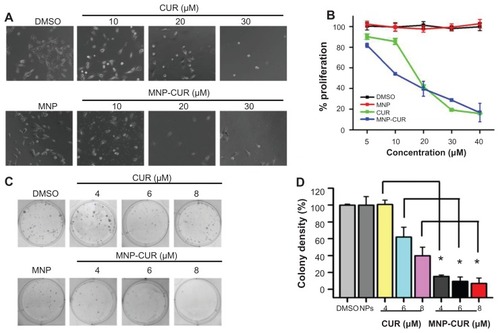
Figure 5 Curcumin-loaded magnetic nanoparticle increases loss of mitochondrial membrane potential. MDA-MB-231 cells (1 × 10⁶) were treated with curcumin and curcumin-loaded magnetic nanoparticles (0–10 μM) for 24 hours and the loss of mitochondrial membrane potential was determined using tetramethyl rhodamine ethyl ester dye. (A) Representative tetramethyl rhodamine ethyl ester stain in MDA-MB-231 cells after treatment with curcumin and curcumin-loaded magnetic nanoparticle formulation. Less intense stain indicates loss of mitochondrial membrane potential. (B) Quantitative estimation of tetramethyl rhodamine ethyl ester stain was analyzed by flow cytometry. For this analysis, 10,000 cells were injected into an Accuri® C6 Flow Cytometer (BD Accuri Cytometers, Ann Arbor, MI) and fluorescence levels were measured in the FL2 channel. Data represent the mean of three repeats for each treatment (mean ± standard error of the mean). *P < 0.05 for significance difference.
Abbreviations: CUR, curcumin; DMSO, dimethyl sulfoxide; MNP, magnetic nanoparticle formulation; MNP-CUR, curcumin-loaded magnetic nanoparticle formulation; RFU, relative fluorescence units.
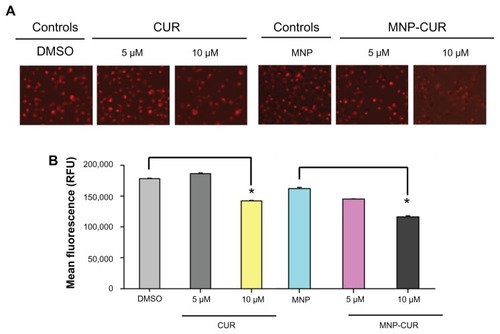
Figure 6 Curcumin-loaded magnetic nanoparticle formulation induces more reactive oxygen species formation. MDA-MB-231 cells (1 × 10⁶) were treated with curcumin or curcumin-loaded magnetic nanoparticle formulation (0–10 μM) for 24 hours, and reactive oxygen species generation was determined using MitoSOX Red dye (Invitrogen Life Technologies, Carlsbad, CA). (A) Representative reactive oxygen species generation images in MDA-MB-231 cells after treatment with curcumin and curcumin-loaded magnetic nanoparticle formulation. (B) Quantitative estimation of reactive oxygen species generation was analyzed by flow cytometer. For this analysis, 10,000 cells were injected into an Accuri® C6 flow cytometer (BD Accuri Cytometers, Ann Arbor, MI) and fluorescence levels were measured in the FL2 channel. Data represent the mean of three repeats for each treatment (mean ± standard error of the mean). *P < 0.05 for significance difference.
Abbreviations: CUR, curcumin; DMSO, dimethyl sulfoxide; MNP, magnetic nanoparticle formulation; MNP-CUR, curcumin-loaded magnetic nanoparticle formulation; RFU, relative fluorescence units.
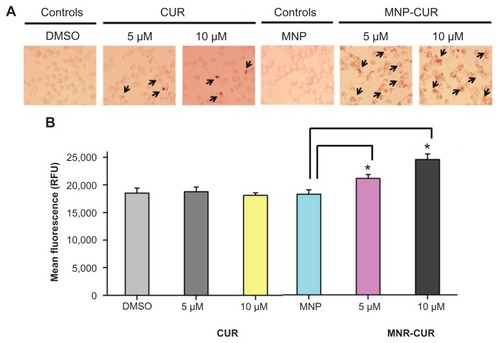
Figure 7 In vitro magnetic resonance image characteristics of magnetic nanoformulations. (A) Signal intensity T2-weighted magnetic resonance images of magnetic nanoparticle formulation, magnetic nanoparticle formulation in MDA-MB-231 cancer cells, curcumin-loaded magnetic nanoparticle formulation, and curcumin-loaded magnetic nanoparticle formulation in MDA-MB-231 cancer cells in 3% phantom agar gel (10–40 μg/mL) scanned under a 9.4 T vertical bore magnetic resonance image scanner (Agilent Technologies, Santa Clara, CA) at 25°C. (B) T2 relaxation curves of magnetic nanoformulations in phantom agar gel. (C) T2 relaxation rate R2 (1/T2) plotted as a function of the iron concentration for magnetic nanoformulations.
Abbreviations: MNP, magnetic nanoparticle formulation; MNP-CUR, curcumin-loaded magnetic nanoparticle formulation; TE, echo time.
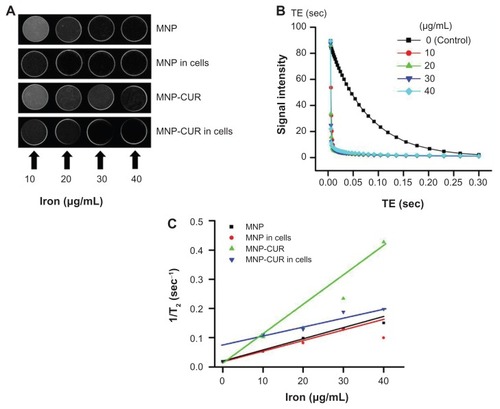
Figure 8 Curcumin-loaded magnetic nanoparticle formulation magnetic targeting improves curcumin uptake by MDA-MB-231 cells. (A) Schematic representation of experimental design for magnetic targeting. Cells (2 × 10⁵) were seeded in six-well plates and treated for 3 hours with 2.5, 5, and 7.5 μM of (1) curcumin, (2) curcumin-loaded magnetic nanoparticle formulation, or (3) curcumin-loaded magnetic nanoparticle formulation in the presence of a neodymium external magnet. (B) Curcumin uptake by cancer cells was visualized using a fluorescence microscope (1×71; Olympus Corporation, Tokyo, Japan). (C) Internalized fluorescence levels were analyzed using an Accuri® C6 flow cytometer (BD Accuri Cytometers, Ann Arbor, MI) in the FL1 channel. Data represent the mean of three repeats for each treatment (mean ± standard error of the mean) and expressed in fold change compared to respective controls. *P < 0.05 for significance difference.
Abbreviations: CUR, curcumin; MNP-CUR, curcumin-loaded magnetic nanoparticle formulation.
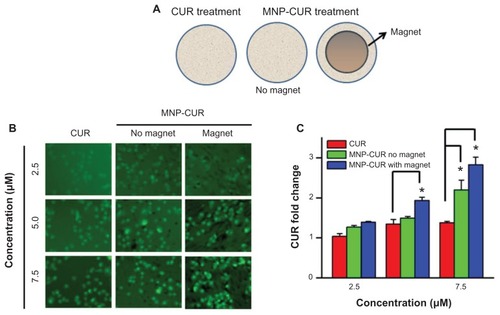
Figure 9 Schematic representation for theranostic application of MNP-CUR formulation.
Abbreviations: MNPs, magnetic nanoparticles; MNP-CUR, curcumin-loaded magnetic nanoparticle.
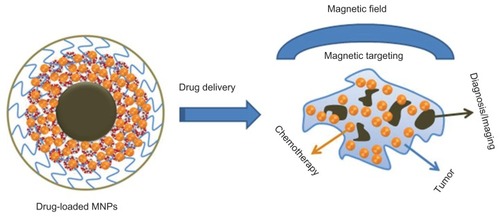
Figure A1 Composition and particle size evaluation of magnetic nanoparticles. (A) Schematic representation of the synthesis route of a multifunctional magnetic nanoparticle. Iron oxide (magnetic) nanoparticles prepared by chemical precipitation reaction in presence of β-cyclodextrin and subsequent F68 polymer coating leads to magnetic nanoparticle nanoformulation. (B) Transmission electron microscopic image of pure iron oxide core nanoparticles (no coating with β-cyclodextrin/F68 polymer), iron oxide nanoparticles coated with 100 mg of β-cyclodextrin, and iron oxide nanoparticles coated with 100 mg of β-cyclodextrin and 200 mg of F68 polymer. Data show an individual particle grain size of ~9 nm. (C) Dynamic light scattering particle size data of (1) pure iron oxide core nanoparticles, (2) iron oxide nanoparticles coated with β-cyclodextrin, and (3) iron oxide nanoparticles coated with β-cyclodextrin and F68 polymer representing aggregative particles size in aqueous media.
Note: β-cyclodextrin and F68 polymer coating help to reduce particle aggregative phenomenon.
Abbreviations: CD-IOCNP, iron oxide core nanoparticles coated with CD (100 mg); F68-CD-IOCNP/MNP, iron oxide core nanoparticles coated with CD (100 mg) and F68 polymer (200 mg); IOCNP, iron oxide core nanoparticles.
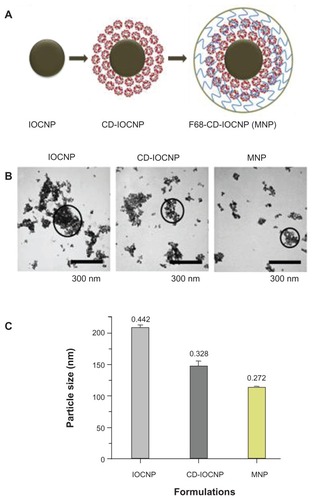
Figure A2 Magnified view of transmission electron microscopic images of MDA-MB-231 cells after treatment with curcumin-loaded magnetic nanoparticles (20 μM) for 6 hours. Accumulation of curcumin-loaded magnetic nanoparticles occurs throughout the cytoplasm.
Note: Red arrows represent nanoparticles accumulation.

Figure A3 Curcumin-loaded magnetic nanoparticle formulation increases MDA-MB-231 cell death. Cells (2 × 10⁵) were seeded in six-well plates and treated for 24 hours with 2.5, 5, and 7.5 μM of curcumin or curcumin-loaded magnetic nanoparticles. The cells were collected both live and dead (floating) and incubated at room temperature in the dark with 5 μL propidium iodide for 20 minutes in 2 mL medium containing hydroxyethyl piperazineethanesulfonic acid without phenol red. After completion of the incubation period, propidium iodide stain was quantified for 5000 cells using an Accuri® C6 flow cytometer (BD Accuri Cytometers, Ann Arbor, MI) in the FL2 channel. The experiment was conducted in triplicate.
Abbreviations: CUR, curcumin; MNP-CUR, curcumin-loaded nanoparticles; PI, propidium iodide.
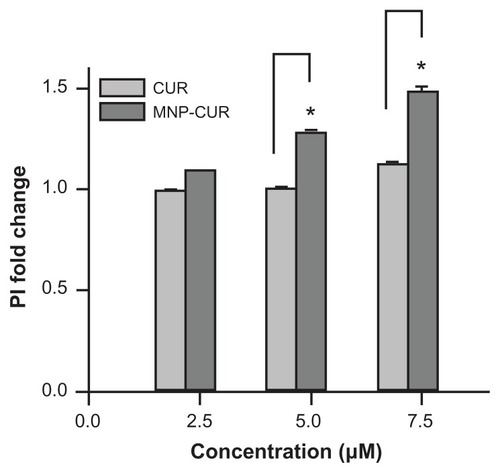
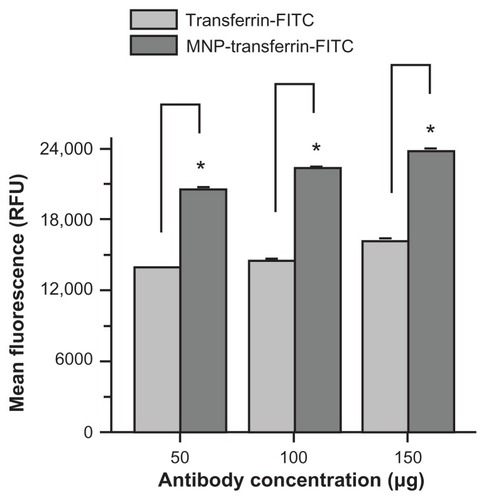
Figure A4 Antitransferrin-fluorescein isothiocyanate antibody conjugation promotes magnetic nanoparticles targeting MDA-MB-231 cancer cells. Cells (2 × 10⁵) were seeded in six-well plates and treated for 24 hours with 50, 100, and 150 μg of antitransferrin-fluorescein isothiocyanate antibody or magnetic nanoparticles conjugated with antitransferrin-fluorescein isothiocyanate antibody. The cells were trypsinized and collected in 1 mL medium containing hydroxyethyl piperazineethanesulfonic acid without phenol red. Fluorescein isothiocyanate levels were analyzed for 5000 cells using an Accuri® C6 flow cytometer (BD Accuri Cytometers, Ann Arbor, MI) in the FL1 channel. The experiment was conducted in triplicate.
Note: Antitransferrin-fluorescein isothiocyanate conjugation was performed according to previous protocol.Citation19 In detail, 5 mg of magnetic nanoparticles and 1 mg of eight-arm N-hydroxysuccinimide–polyethylene glycol–N-hydroxysuccinimide linker (Nanocs Inc, Boston, MA) were dispersed in 1 mL phosphate buffered saline. After 1 hour, 500 μg of antitransferrin-fluorescein isothiocyanate was mixed and allowed to link onto magnetic nanoparticles overnight. To this mixture, 500 μg of bovine serum albumin was added to nullify excess N-hydroxysuccinimide reactivity. The conjugation efficiency was found to be 92%.
Abbreviations: MNP-transferrin-FITC, magnetic nanoparticles conjugated with antitransferrin-fluorescein isothiocyanate antibody; RFU, relative fluorescence units; transferrin-FITC, antitransferrin-fluorescein isothiocyanate antibody.