Figures & data
Figure 1 Frontal reconstruction of conventional computed tomography of the left tibia 6 months after creation of the defect. Bulky scar tissue was observed at the outer side of the defect. The defect cavity was filled with fibrous connective tissue (A). Histological section of the defect in the left tibia 6 months after creation of the defect (HE, original magnification 25×): There is no bony ingrowth into the defect. The defect itself is empty because the loose-fitting interconnecting tissue washed out during histological preparation. Hyaline cartilage can be seen on the right side (B). Histological section 6 weeks after implantation of the bone substitute material (HE, original magnification 100×): The implant is completely embedded into new bone. At the surface of the biomaterial, multiple darkly stained giant cells are detectable, marked by arrowheads (C). Histological section 6 weeks after implantation (TRAP staining, original magnification 200×): Arrowheads indicate TRAP-positive multinucleated cells adjacent to the biomaterial at the interface (D).
Abbreviations: HE, hematoxylin and eosin; HC, hyaline cartilage; NFB, newly formed bone; BGS, bone graft substitute; SCT, soft connective tissue; TRAP, tartrate-resistant acid phosphatase.
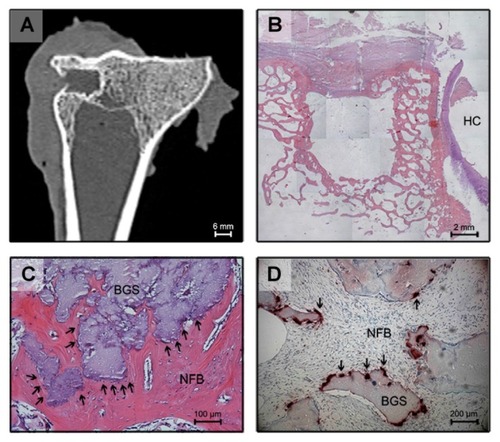
Figure 2 Histological section 12 weeks after implantation (HE, original magnification 25×): ROI is marked by a dotted line. Bony ingrowth occurs from the margins of the defect, especially from the periost to the center of the defect (A). Detail of : The fractions of tissue are marked (B). Histological section 26 weeks after implantation (osteocalcin staining, 200×): Osteoblast activity along the biomaterial and fibrous tissue is visualized (arrowheads). Cement lines within the newly formed bone also stain positively for osteocalcin (C). Histological section 26 weeks after implantation (TRAP staining, original magnification 100×): The granules of the biomaterial are mostly surrounded by new bone formation, but in contrast to fibrous tissue osteoclasts are still detectable (marked by arrowheads) (D). Histological section 26 weeks after implantation (HE, original magnification 100×): After a half-year, cellular activity is still apparent at the interface between bone and biomaterial, particularly near the newly formed blood vessels (E).
Abbreviations: HE, hematoxylin and eosin; CD, center of the defect; NFB, newly formed bone; BGS, bone graft substitute; ROI, region of interest; SCT, soft connective tissue; BV, blood vessel; TRAP, tartrate-resistant acid phosphatase.
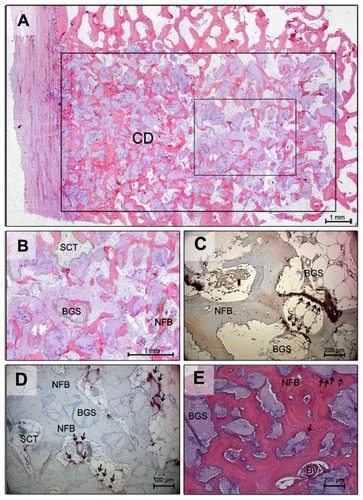
Figure 3 Summary of the histomorphometric data: There is significant increase of the bone area within the first 3 months, while the fraction of the biomaterial remains unaffected over time.
Notes: The fraction of the soft connective tissue shows a marked decrease within the first 12 weeks. Mean value ± standard error of the mean; analysis of variance; *P < 0.05 vs 6 weeks.
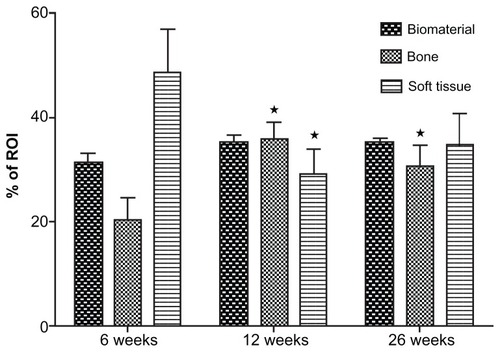
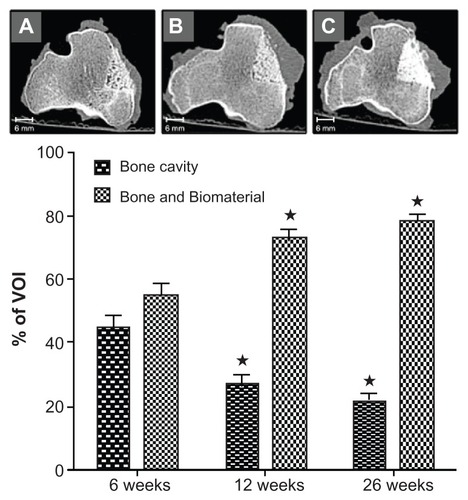
Figure 4 Analysis of the micro-CT data: A decrease of the bone cavity with the simultaneous increase of radiopaque material is significant within the first 3 months, while the size of the cavity is diminishing. Conventional CT images at 6 (A), 12 (B), and 26 (C) weeks after the procedure and implantation of the biomaterial confirm these findings.
Notes: Mean value ± standard error of the mean; analysis of variance; *P < 0.05 vs 6 weeks.
Abbreviation: CT, computed tomography.