Figures & data
Figure 1 The scheme for the green synthesis of phytomolecules-coated NiO nanoparticles using Abutilon indicum leaves extract.
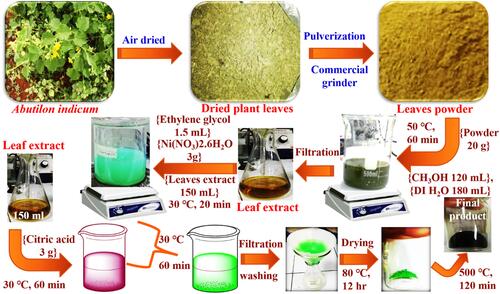
Figure 2 The probable mechanistic synthesis pathway for the fabrication of phytomolecules-coated NiO nanoparticles using Abutilon indicum leaves extract.Notes: Adapted from Khan SA, Shahid S, Lee CS. Green synthesis of gold and silver nanoparticles using leaf extract of clerodendrum inerme; characterization, antimicrobial, and antioxidant activities. Biomolecules. 2020;10(6):835.Citation16
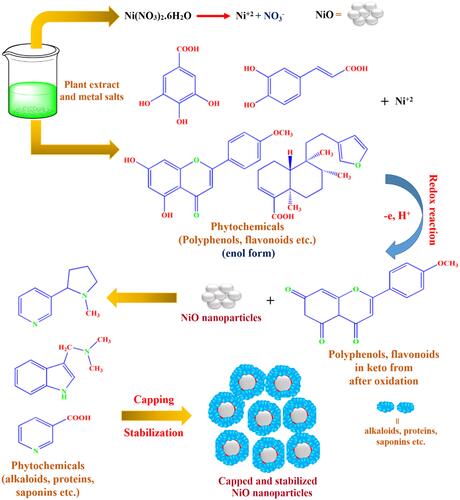
Figure 3 UV-Visible spectra of (A) Abutilon indicum leaves extract, and (B) phytomolecules-coated NiO nanoparticles. (C) FTIR spectrum of Abutilon indicum leaves extract, and phytomolecules-coated NiO nanoparticles.
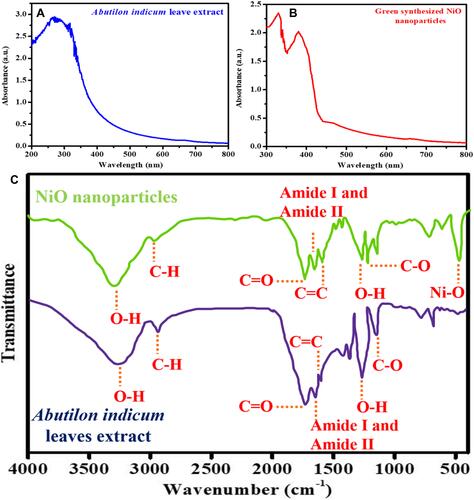
Figure 4 The (A) XRD, (B) SEM, (C) DLS particle size distribution, and (D) EDX of phytomolecules-coated NiO nanoparticles using Abutilon indicum leaves extract.
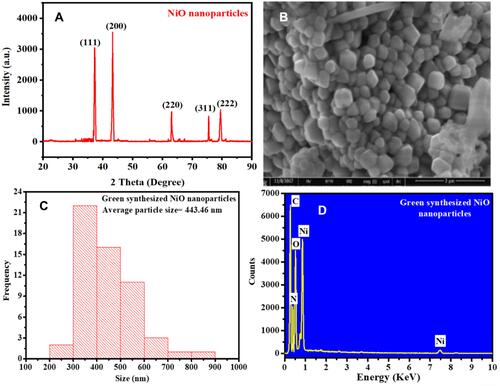
Figure 5 The antibacterial propensity in terms of ZOIs; (A) plant leaves extract, (B) chemically synthesized NiO nanoparticles, (C) phytomolecules-coated NiO nanoparticles (F = 1072.028, p < 0.001), and (D) antibacterial drug.
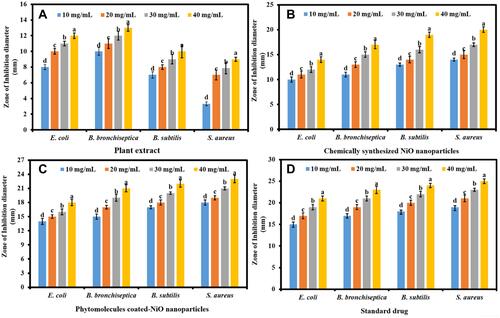
Figure 6 (A) The representative agar plates of S. aureus treated with plant extract, phytomolecules-coated NiO nanoparticles, and standard drug. (B) The probable antibacterial mechanism of the phytomolecules-coated NiO nanoparticles Notes:Adapted from Srihasam S, Thyagarajan K, Korivi M, Lebaka VR, Mallem SP. Phytogenic generation of NiO nanoparticles using Stevia leaf extract and evaluation of their in-vitro antioxidant and antimicrobial properties. Biomolecules. 2020;10(1):89. Citation56
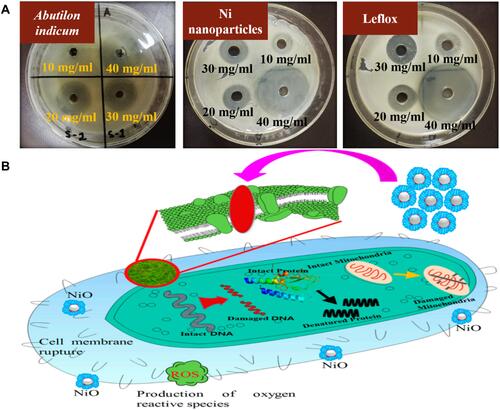
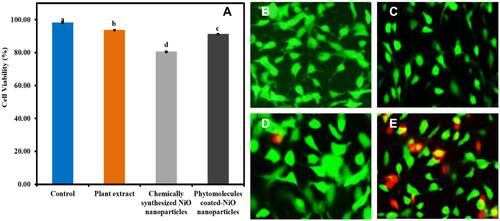
Figure 7 The anticancer potential of phytomolecules-coated NiO nanoparticles compared to leaves extract of Abutilon indicum, chemically synthesized NiO nanoparticles, and standard drug in terms of cell viability percentage against HeLa cancer cells (F = 7225.663, p < 0.001).
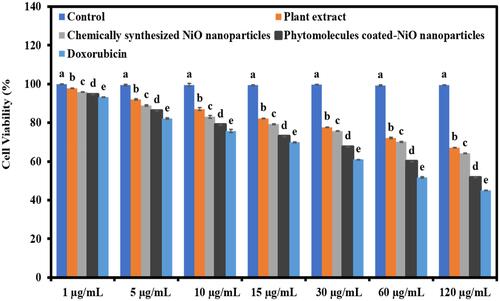
Figure 8 The inverted micrographs of HeLa cells were incubated with (B) plant extract, (C) chemically synthesized NiO nanoparticles, and (D) phytomolecules-coated NiO nanoparticles. The fluorescence micrograph of live and dead HeLa cells incubated with (F) plant extract, (G) chemically synthesized NiO nanoparticles, and (H) phytomolecules-coated NiO nanoparticles. (A) and (E) control (scale bar, 100 µm).
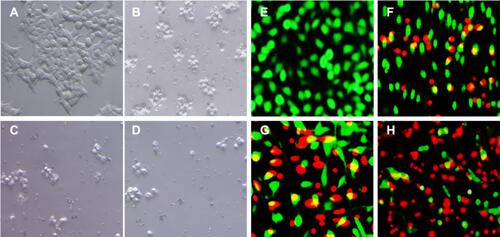
Figure 9 The antioxidant activity results of phytomolecules-coated NiO nanoparticles in terms of %DPPH scavenging at different concentration levels than plant extract, chemically synthesized NiO nanoparticles, and BHT.
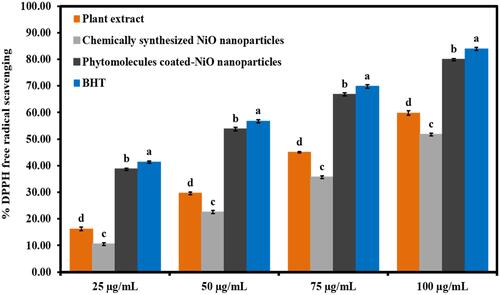
Figure 10 (A) The biocompatibility results of phytomolecules-coated NiO nanoparticles with fibroblast cells compared to other tested samples (Note: Tukey based heterogeneous lower-case letters represent significant pairs). The fluorescence micrograph of live and dead fibroblast cells incubated with samples. (B) control, (C) plant extract, (D) green synthesized NiO, and (E) chemically synthesized NiO nanoparticles (scale bar 100 µm).