62
Views
18
CrossRef citations to date
0
Altmetric
Original Research

Cerium dioxide nanoparticles do not modulate the lipopolysaccharide-induced inflammatory response in human monocytes

, , , , , , , & show all
Pages 1387-1397 | Published online: 13 Mar 2012

Figures & data

Table 1 Population demographics

Figure 1 Schematic presentation of the experimental design used in the present study to elaborate the inflammation-modulating effects of CeO2 nanoparticles.

Abbreviation: LPS, lipopolysaccharides.
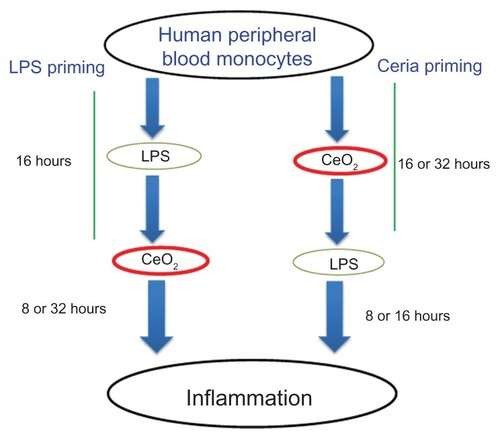
Figure 1 Schematic presentation of the experimental design used in the present study to elaborate the inflammation-modulating effects of CeO2 nanoparticles.Abbreviation: LPS, lipopolysaccharides.

Table 2 Particle characteristics

Figure 2 Physicochemical characterization of CeO2 nanoparticles. (A) Transmission electron microscopic images of nanoparticle suspensions (low and high magnification). (B) X-ray diffraction analysis pattern of CeO2 nanoparticles. (C) Dynamic light scattering analysis of CeO2 nanoparticles suspension (1 μg/mL) in ex-vivo cell culture medium performed using Malvern Zetasizer Nano.
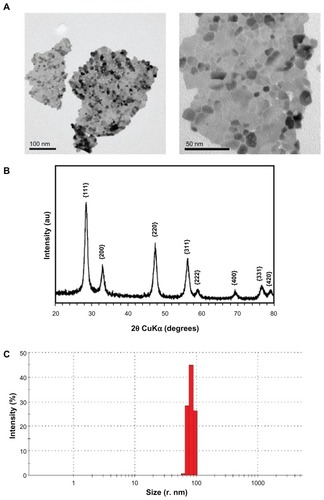
Figure 2 Physicochemical characterization of CeO2 nanoparticles. (A) Transmission electron microscopic images of nanoparticle suspensions (low and high magnification). (B) X-ray diffraction analysis pattern of CeO2 nanoparticles. (C) Dynamic light scattering analysis of CeO2 nanoparticles suspension (1 μg/mL) in ex-vivo cell culture medium performed using Malvern Zetasizer Nano.

Figure 3 Transmission electron microscopic analysis of CeO2 nanoparticle-treated human monocytes. Cells were treated with (A) media, (B) 0.5 μg/mL, and (C) 1 μg/mL CeO2 nanoparticles for 24 hours and ultrastructural changes were observed.

Note: Arrows point to the particle aggregates.
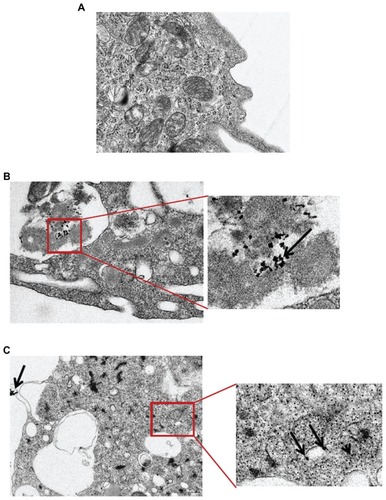
Figure 3 Transmission electron microscopic analysis of CeO2 nanoparticle-treated human monocytes. Cells were treated with (A) media, (B) 0.5 μg/mL, and (C) 1 μg/mL CeO2 nanoparticles for 24 hours and ultrastructural changes were observed.Note: Arrows point to the particle aggregates.

Figure 4 Evaluation of human monocyte cytotoxicity after exposure to CeO2 nanoparticles. (A) Cells were treated with different doses of nanoparticles (0.5–10 μg/mL) for 24 or 48 hours, stained with propidium iodide for membrane integrity, and analyzed using flow cytometry. (B) Cells were exposed to noncytotoxic doses of CeO2 nanoparticles either in the presence or absence of lipopolysaccharides for 24 or 48 hours as shown in , stained with propidium iodide and analyzed using flow cytometry.

Notes: Data are presented as the mean ± standard error of the mean and analyzed by analysis of variance, followed by Tukey’s post hoc test. n = 5; *P < 0.05; **P < 0.01; ***P < 0.001.

Abbreviations: PI, propidium iodide; LPS, lipopolysaccharides.
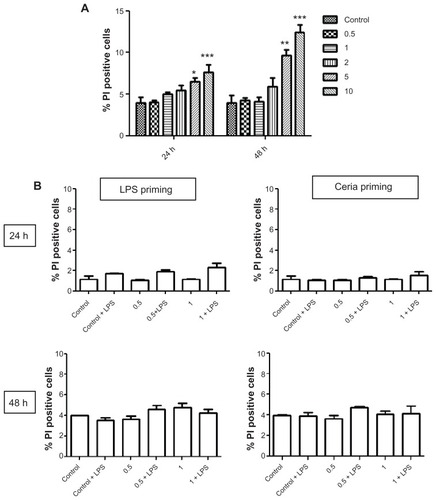
Figure 4 Evaluation of human monocyte cytotoxicity after exposure to CeO2 nanoparticles. (A) Cells were treated with different doses of nanoparticles (0.5–10 μg/mL) for 24 or 48 hours, stained with propidium iodide for membrane integrity, and analyzed using flow cytometry. (B) Cells were exposed to noncytotoxic doses of CeO2 nanoparticles either in the presence or absence of lipopolysaccharides for 24 or 48 hours as shown in Figure 1, stained with propidium iodide and analyzed using flow cytometry.Notes: Data are presented as the mean ± standard error of the mean and analyzed by analysis of variance, followed by Tukey’s post hoc test. n = 5; *P < 0.05; **P < 0.01; ***P < 0.001.Abbreviations: PI, propidium iodide; LPS, lipopolysaccharides.

Table 3A Cytokine concentrations without priming

Table 3B Cytokine concentrations after priming

Figure 5 Evaluation of inflammation modulating ability of CeO2 nanoparticles in human monocytes. Cells were treated according to the protocol presented in and the amount of TNF-α in cell culture supernatants was analyzed by enzyme-linked immunosorbent assay according to the manufacturer’s recommendations.

Notes: Data are presented as the mean ± standard error of the mean and analyzed by analysis of variance, followed by Tukey’s post hoc test. n = 5–10; ***P < 0.001.

Abbreviations: LPS, lipopolysaccharides; TNF-α, tumor necrosis factor-alpha.
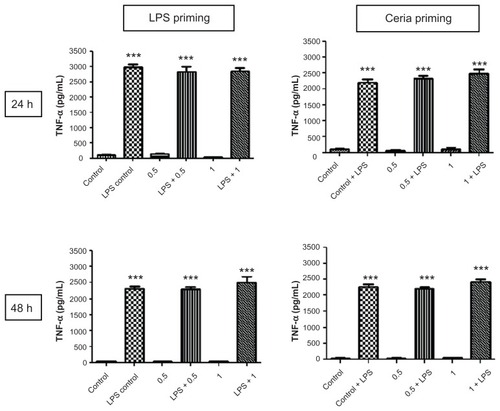
Figure 5 Evaluation of inflammation modulating ability of CeO2 nanoparticles in human monocytes. Cells were treated according to the protocol presented in Figure 1 and the amount of TNF-α in cell culture supernatants was analyzed by enzyme-linked immunosorbent assay according to the manufacturer’s recommendations.Notes: Data are presented as the mean ± standard error of the mean and analyzed by analysis of variance, followed by Tukey’s post hoc test. n = 5–10; ***P < 0.001.Abbreviations: LPS, lipopolysaccharides; TNF-α, tumor necrosis factor-alpha.

Figure 6 Evaluation of inflammation-modulating ability of CeO2 nanoparticles in human monocytes. Cells were treated according to the protocol presented in and the amount of IL-1β in cell culture supernatants was analyzed by the Bioplex assay according to the manufacturer’s recommendations.

Notes: Data are presented as the mean ± standard error of the mean and analyzed by analysis of variance, followed by Tukey’s post hoc test. n = 5–10; ***P < 0.001.

Abbreviations: IL-1β, tumor necrosis factor-alpha; LPS, lipopolysaccharides.
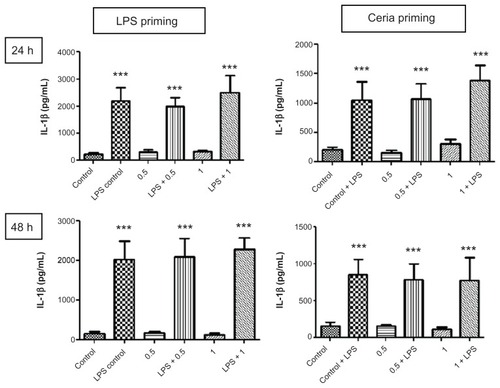
Figure 6 Evaluation of inflammation-modulating ability of CeO2 nanoparticles in human monocytes. Cells were treated according to the protocol presented in Figure 1 and the amount of IL-1β in cell culture supernatants was analyzed by the Bioplex assay according to the manufacturer’s recommendations.Notes: Data are presented as the mean ± standard error of the mean and analyzed by analysis of variance, followed by Tukey’s post hoc test. n = 5–10; ***P < 0.001.Abbreviations: IL-1β, tumor necrosis factor-alpha; LPS, lipopolysaccharides.