Figures & data
Table 1 Physical characteristics of drug nanoparticles
Figure 1 Effect of nanoformulated crystalline antiretroviral drugs on human brain microvascular endothelial cell (HBMEC) viability. Endothelial cells were loaded for 2 hours with four nanoformulations of indinavir (IDV) (A), six nanoformulations of ritonavir (RTV) (B and E), two nanoformulations of atazanavir (ATV) (D), or efavirenz (EFV) (C) at 0.1 mM. H2009 was used at 0.18 mM and 0.27 mM. Controls consisted of untreated cells and cells exposed to similar concentrations of free (without nanoparticles [NP]) IDV, RTV, or EFV (IDV-no NP, RTV-no NP, EFV-no NP). Additional controls consisted of cells treated with similar concentrations of surfactant or combination of surfactants, and cells exposed to fluconazole alone (without surfactants, F-no NP) (F). Following drug loading, toxicity was assessed over 24 hours or 48 hours by alamarBlue™ assay. The ATV (H3019, H3020) and RTV (H2019, H2020) nanoformulations decreased HBMEC viability, but all other nanoformulated crystalline antiretroviral drugs at concentrations of 0.1 mM had minimal or no effect on HBMEC viability. Similar concentrations of free IDV, RTV, or EFV did not alter HBMEC viability. At 0.27 mM drug concentration, increased toxicity was observed in cells exposed to H2009. All surfactants and fluconazole controls had no major effect on HBMEC viability.
Notes: For each experimental condition, n = 3. Figure shown is representative of three independent experiments. *P < 0.05; **P < 0.01; ***P < 0.001; #P < 0.0001.
![Figure 1 Effect of nanoformulated crystalline antiretroviral drugs on human brain microvascular endothelial cell (HBMEC) viability. Endothelial cells were loaded for 2 hours with four nanoformulations of indinavir (IDV) (A), six nanoformulations of ritonavir (RTV) (B and E), two nanoformulations of atazanavir (ATV) (D), or efavirenz (EFV) (C) at 0.1 mM. H2009 was used at 0.18 mM and 0.27 mM. Controls consisted of untreated cells and cells exposed to similar concentrations of free (without nanoparticles [NP]) IDV, RTV, or EFV (IDV-no NP, RTV-no NP, EFV-no NP). Additional controls consisted of cells treated with similar concentrations of surfactant or combination of surfactants, and cells exposed to fluconazole alone (without surfactants, F-no NP) (F). Following drug loading, toxicity was assessed over 24 hours or 48 hours by alamarBlue™ assay. The ATV (H3019, H3020) and RTV (H2019, H2020) nanoformulations decreased HBMEC viability, but all other nanoformulated crystalline antiretroviral drugs at concentrations of 0.1 mM had minimal or no effect on HBMEC viability. Similar concentrations of free IDV, RTV, or EFV did not alter HBMEC viability. At 0.27 mM drug concentration, increased toxicity was observed in cells exposed to H2009. All surfactants and fluconazole controls had no major effect on HBMEC viability.Notes: For each experimental condition, n = 3. Figure shown is representative of three independent experiments. *P < 0.05; **P < 0.01; ***P < 0.001; #P < 0.0001.](/cms/asset/8677e438-fa2f-4aeb-8c55-c1e8e325eead/dijn_a_29454_f0001_b.jpg)
Figure 2 Uptake of nanoformulated crystalline antiretroviral drugs (nanoART) by human brain microvascular endothelial cells (HBMEC) following endothelial-mononuclear phagocyte cocultivation. (A–C) Primary HBMEC were exposed for 2 hours to conditioned media from monocyte-derived macrophages (MDM) loaded with rhodamine-labeled efavirenz (P4004) as described in the Methods section; HBMEC were then washed three times with phosphate buffered saline to remove MDM-conditioned media, and analyzed by fluorescence microscopy. Panels (B and C) show endothelial cells uptake of nanoART (orange-yellow color) released by MDM. Staining with the endothelium-specific marker, von Willebrand factor (green, A) confirmed the endothelial nature of our primary HBMEC. (D–F) Primary HBMEC labeled with DiO (green, D) were cocultured for 2 hours with monocytes loaded with rhodamine-labeled ritonavir (H2013), washed to remove monocytes, and analyzed by fluorescence microscopy. Panels (E and F) show endothelial cells uptake of nanoART (orange-yellow color) during endothelial-monocyte cocultivation.
Note: All panels are at 200× magnification.
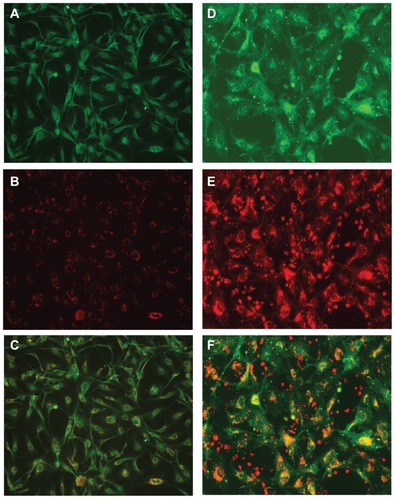
Figure 3 Endothelial cell nanoformulated crystalline antiretroviral drug (nanoART) uptake follows mononuclear phagocyte cocultivation. (A and B) Uptake of rhodamine-labeled ritonavir, H2013 (orange-yellow color) by primary human brain microvascular endothelial cells (HBMEC) (stained with DiO [green] and DAPI [blue for nucleus]) during endothelial-monocyte communication is visualized by confocal microscopy. Smaller nucleus (white arrow heads) shows monocytes (not removed during washes) in close cell-cell communication with HBMEC. (C and D) HBMEC (stained with DiO [green] and DAPI [blue for nucleus]) uptake of DiD-labeled ritonavir, H2013 (orange-yellow color) from monocyte-derived macrophage-conditioned media (C), and during direct endothelial-monocyte communication (D). (E) HBMEC uptake of DiD-labeled folated-modified atazanavir (H3020) (orange-red color) during direct endothelial-monocyte communication.
Notes: Each set of images consists of a top view of cells and nanoART particles, a side view of the XZ optical line scan through the yellow line, and a side view of the YZ optical line scan through the purple line. From those side view optical images, nanoART particles are seen inside the cells (arrows). For all panels, orange-colored arrows indicate nanoART (red fluorescence) colocalized with HBMEC vesicles; white arrows indicate nanoART (red fluorescence) or DiO-labeled membrane-bound vesicles (green fluorescence) that are not colocalized. Magnifications are at 630× (A), 720× (E), and 1000× (B–D).
![Figure 3 Endothelial cell nanoformulated crystalline antiretroviral drug (nanoART) uptake follows mononuclear phagocyte cocultivation. (A and B) Uptake of rhodamine-labeled ritonavir, H2013 (orange-yellow color) by primary human brain microvascular endothelial cells (HBMEC) (stained with DiO [green] and DAPI [blue for nucleus]) during endothelial-monocyte communication is visualized by confocal microscopy. Smaller nucleus (white arrow heads) shows monocytes (not removed during washes) in close cell-cell communication with HBMEC. (C and D) HBMEC (stained with DiO [green] and DAPI [blue for nucleus]) uptake of DiD-labeled ritonavir, H2013 (orange-yellow color) from monocyte-derived macrophage-conditioned media (C), and during direct endothelial-monocyte communication (D). (E) HBMEC uptake of DiD-labeled folated-modified atazanavir (H3020) (orange-red color) during direct endothelial-monocyte communication.Notes: Each set of images consists of a top view of cells and nanoART particles, a side view of the XZ optical line scan through the yellow line, and a side view of the YZ optical line scan through the purple line. From those side view optical images, nanoART particles are seen inside the cells (arrows). For all panels, orange-colored arrows indicate nanoART (red fluorescence) colocalized with HBMEC vesicles; white arrows indicate nanoART (red fluorescence) or DiO-labeled membrane-bound vesicles (green fluorescence) that are not colocalized. Magnifications are at 630× (A), 720× (E), and 1000× (B–D).](/cms/asset/48f091ac-832f-4ccc-88b3-1b8eb8529d3e/dijn_a_29454_f0003_c.jpg)
Figure 4 Transfer of nanoformulated crystalline antiretroviral drugs (nanoART) from mononuclear phagocyte to human brain microvascular endothelial cells (HBMEC) follows cell cocultivation. Monocytes loaded with 0.1 mM or 0.5 mM rhodamine-labeled indinavir (IDV) (H1013b, A and B) or ritonavir (RTV) (H2013, C and D) nanoformulations were cocultured for 2 hours with HBMEC as described in the Methods section, and the levels of nanoART in monocytes before and after coculture quantified by fluorescence-activated cell sorting analysis. Coculture of monocytes loaded with 0.1 mM IDV (A) or RTV (C) nanoART with HBMEC decreased IDV and RTV nanoART levels in monocytes by 83% (A, dotted line, and E), and 71% (C, dotted line, and E). Coculture of monocytes loaded with 0.5 mM IDV (B) or RTV (D) nanoART with HBMEC decreased IDV and RTV nanoART levels in monocytes by 44.5% (B, dotted line, and E), and 49.6% (D, dotted line, and E).
Notes: ***P < 0.001. Each experimental condition was performed in triplicate, and data shown are representative of four independent experiments.
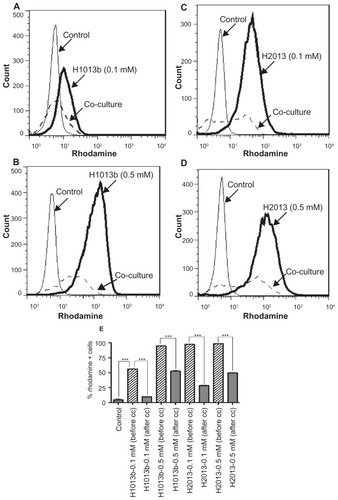
Figure 5 Quantification of nanoformulated crystalline antiretroviral drug (nanoART) transfer from mononuclear phagocytes to human brain microvascular endothelial cells (HBMEC). (A and B) HBMEC fluorescently labeled with DiD (excitation 644 nm) were cocultured for 2 hours with monocytes loaded with rhodamine-labeled ritonavir (RTV) nanoformulations (excitation 543 nm). Monocytes were removed by three to five washes and HBMEC harvested and analyzed by fluorescence-activated cell sorting. Endothelial-monocyte communication resulted in nanoART transfer to over 46% of HBMEC. (C and D) Unlabeled HBMEC were cocultured for 2 hours with monocytes loaded with DiD-labeled atazanavir (ATV) (C) and RTV (D) nanoformulations. Monocytes were removed by three to five washes and HBMEC harvested and analyzed by fluorescence-activated cell sorting. Endothelial-monocyte communication resulted in transfer of ATV (H3019) and folate-coated ATV (H3020) nanoformulations to 52% and 64.4% of HBMEC, respectively (C), and also resulted in transfer of RTV (H2019) and folate-coated RTV (H2020) nanoformulations to 50% and 77.3% of HBMEC, respectively (D).
Note: Each experimental condition was performed in triplicate, and data shown are representative of two independent experiments.
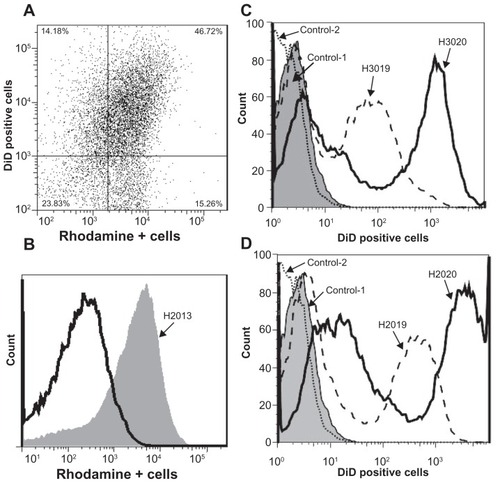
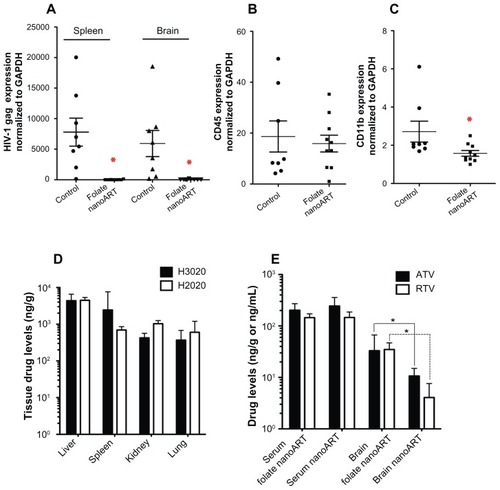
Figure 6 Antiretroviral activity and drug biodistribution of folate-coated nanoformulated crystalline antiretroviral drugs (nanoART). Folate-coated nanoART were injected subcutaneously on Days 0 and 7 as a combination of atazanavir (ATV) (H3020) and ritonavir (RTV) (H2020) (250 mg/kg each) to peripheral blood lymphocyte-NOD/scid-γcnull mice infected with HIV-1ADA 12 hours before initial nanoART dose. Peripheral blood and tissues were collected on Day 14 after initial nanoART injection, followed by RNA extraction and real-time polymerase chain reaction for HIV-1 gag (A), human CD45 (B), and mice CD11b (C), and normalized to glyceraldehyde-3-phosphate dehydrogenase mRNA. NanoART-treated mice showed a significant decrease in HIV-1 gag in the spleen and brain (A, *P < 0.01), and CD11b RNA in brain (C, *P < 0.04). CD45 levels were similar in the brains of treated and untreated mice (B). For (A–C), values are expressed as mean ± standard error of the mean (bar ± whisker). (D) Tissue (ng/g) and serum (ng/mL) drug levels in mice at 14 days after initial nanoART injection. (E) Serum (ng/mL) and brain (ng/g) drug levels in HIV-1-infected peripheral blood lymphocyte-NOD/ scid-γcnull mice treated with uncoated nanoART (H3019 and H2019) or folate-coated nanoART (H3020 and H2020) (250 mg/kg ATV/RTV, subcutaneously).
Notes: Significantly higher levels of ATV and RTV were detected in brain tissues of infected animals treated with folate-coated nanoART, compared with animals treated with uncoated nanoformulations (*P < 0.02). Drug levels are expressed as median ± 25th and 75th percentiles due to non-normality of data. For panels (A–C), n = 8 for control, and n = 10 for the drug-treated group. For panels (D and E), n = 8 in each group.