Figures & data
Figure 1 (A) Schematic presentation of rosuvastatin-loaded nanomicelles injection into an ICH mouse. (B) Experimental protocol and timeline.
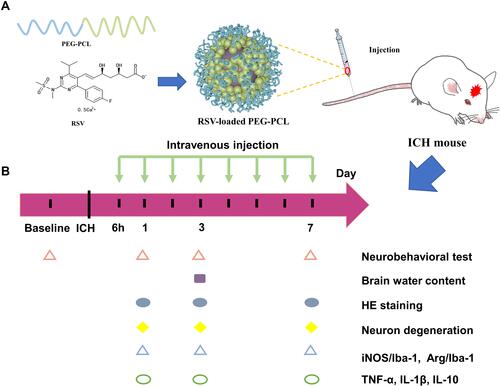
Figure 2 Characterization of rosuvastatin-loaded nanomicelles. (A) TEM image of rosuvastatin-loaded nanomicelles, scale bar = 100 nm. (B) Particle sizes of rosuvastatin-loaded nanomicelles detected by DLS.
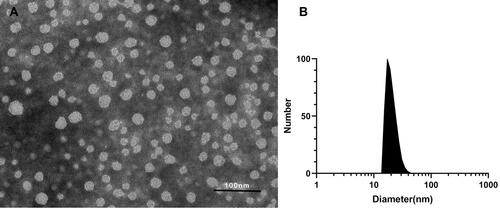
Figure 3 Cytotoxicity of the nanomicelles with different concentrations. The ratio of the sample absorbance to that of the blank control group presents the cell viability rate.
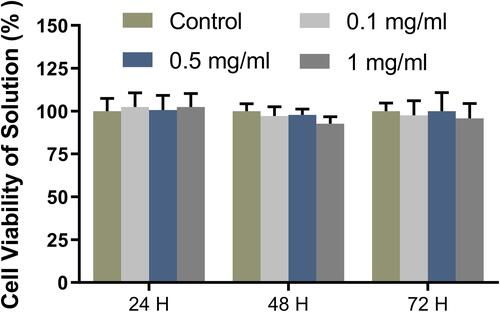
Figure 4 Neurological deficits and brain edema. (A) Neurological deficit score after ICH. (B) Percentage of brain water content. Data are shown as mean ± SD (n = 6), *P < 0.05, **P<0.01, ***P < 0.001.
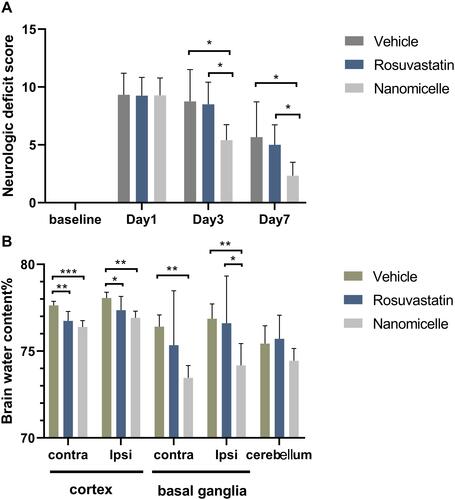
Figure 5 The FJC staining for degenerative neurons. (A) Representative images for FJC staining, scale bar = 50μm. (B) The statistical analysis of the FJC positive cells. Data are shown as mean ± SD (n = 4), *P < 0.05, ***P < 0.001.
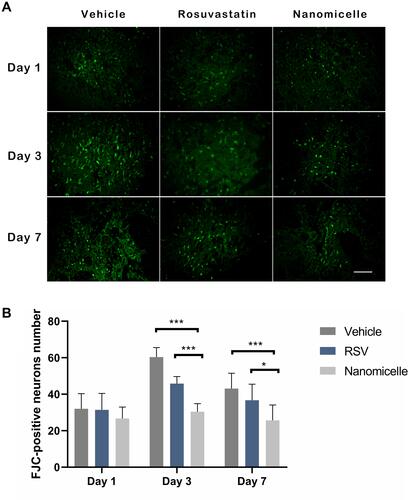
Figure 6 H&E staining. The overall morphology of the brain section at different time-point. Magnified images shows the surrounding of the lesion. Scale bar = 100 μm.
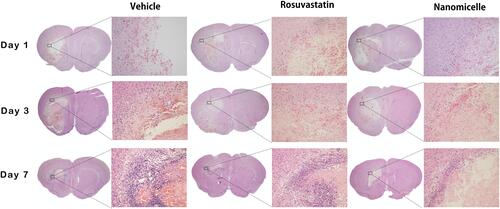
Figure 7 The effects of nanomicelle on Microglia/macrophages polarization. (A) Immunofluorescence staining of iNOS+Iba-1+ around the hematoma border zone. (B) Western blot analysis of iNOS protein. (C) Immunofluorescence staining of Arg-1+Iba-1+ around the hematoma border zone. (D) Western blot analysis of iNOS protein. Scale bar =100μm. Data are mean ± SD, n = 6 mice per group, *P < 0.05, **P<0.01.
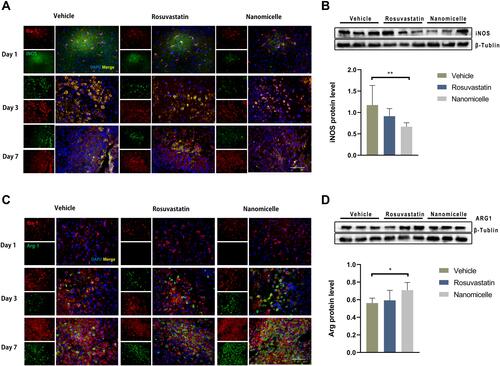
Figure 8 The effects of nanomicelles on RAW 264.7 macrophage cells induced by LPS and INF-γ. (A) Immunofluorescence staining of iNOS. (B) Measurement of mean fluorescent intensity of INOS. (C) ARG-1 immunofluorescence staining. (D) Measurement of mean fluorescent intensity of ARG staining. Scar bar = 50μm, **P<0.01, ***P < 0.001.
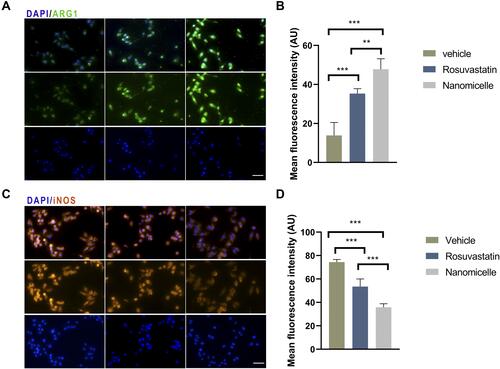
Figure 9 The effects of nanomicelle on pro-inflammatory cytokines in the hematoma border zone. (A) Immunohistochemical staining of IL-1β around the hematoma border zone. (B) Immunohistochemical staining of TNF-α around the hematoma border zone. (C) Western blot analysis of IL-1β. (D) Western blot analysis of TNF-α. Data are mean ± SD, n = 6 mice per group, *P < 0.05, **P<0.01. Scale bar =100 μm.
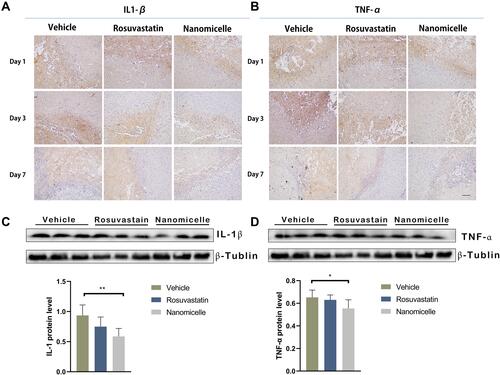
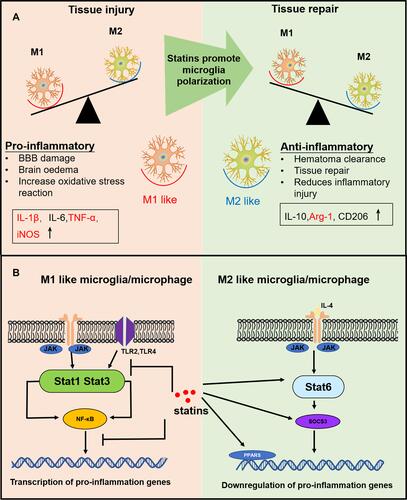
Figure 10 (A) The effects of differentially polarized microglia on intracerebral hemorrhage-induced secondary brain injury. (B) Possible anti-inflammation mechanism of statins.