Figures & data
Table 1 Target cDNA primer sequences used in quantitative polymerase chain reaction
Table 2 Measurement of surface roughness by atomic force microscopy
Figure 1 Immobilized FGF2 compared with FGF2-free samples initially and after 9 days.
Abbreviations: FGF2, fibroblast growth factor 2; NT, nanotube; PT, polished titanium.
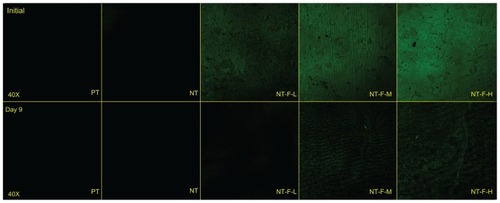
Figure 2 Field emission scanning electron microscopy results. (A) NT surface showed an NT array structure; NT-F-H surface showed clumps of fibroblast growth factor 2 and that the typical NT surface was changed. (B) Profile of titania NT.
Note: The length of NT was 588.85 ± 31.92 nm (mean value ± standard deviation).
Abbreviations: NT, nanotube; PT, polished titanium.
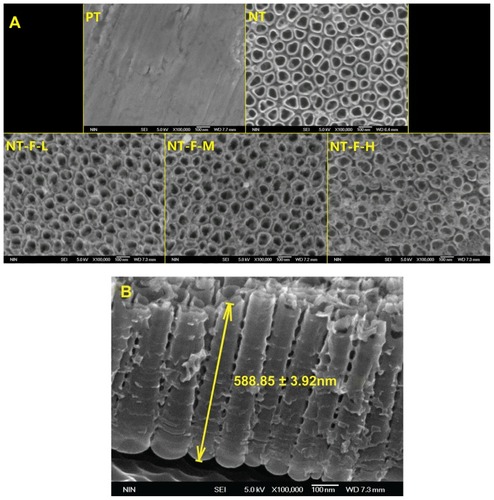
Figure 3 Atomic force microscopy images of different surfaces: (A) PT, (B) NT, (C) NT-F-L, (D) NT-F-M, and (E) NT-F-H. PT showed a microgroove structure, and porous-like structures were observed in other groups.
Abbreviations: NT, nanotube; PT, polished titanium.
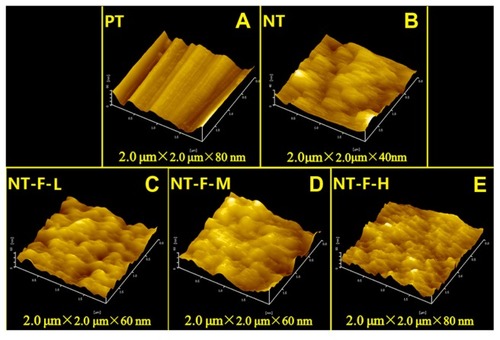
Table 3 Elution of dissolvable FGF2 at different time intervalsTable Footnote*
Figure 4 Elution kinetics of various FGF2 immobilizations. FGF2 eluted rapidly within first 3 days and the elution velocity reduced with time. Approximately all dissolvable FGF2 eluted within 30 days.
Abbreviations: FGF2, fibroblast growth factor 2; NT, nanotube.
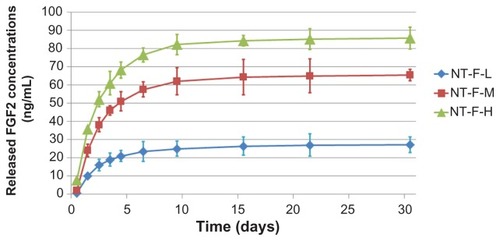
Figure 5 HGF adhesion. (A) HGFs attached to the substrates with 4′,6′-diamidino-2-phenylindole stain and (B) relative cell adhesion rate of attached HGFs. The NT and NT-F-H surfaces inhibited cell adhesion, whereas the NT-F-L and NT-F-M improved cell attachment.
Notes: #Higher than PT (P < 0.01), *lower than PT (P < 0.01), difference also exists between 1*, 2*, 1#, and 2# (P < 0.01).
Abbreviations: HGF, human gingival fibroblast; NT, nanotube; PT, polished titanium.
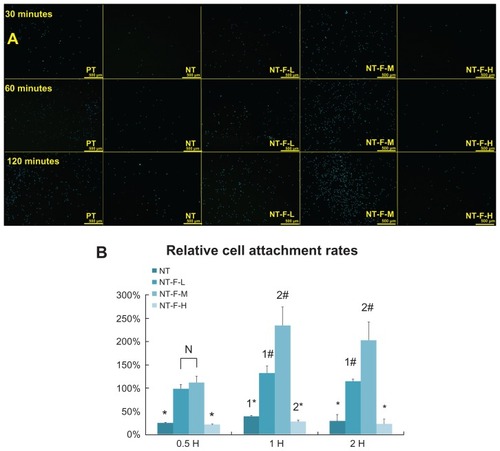
Figure 6 Cell proliferation measured by the methyl-thiazolyl-tetrazolium assay. NT-F-L and NT-F-M showed the higher cell proliferation at each interval, whereas NT-F-H with overimmobilized FGF2 showed the lowest at the early stage (Days 1 and 3).
Notes: #Higher than PT (P < 0.01), *lower than PT (P < 0.01), significant difference exists between 1# and 2# (P < 0.01).
Abbreviations: FGF2, fibroblast growth factor 2; NT, nanotube; OD, optical density; PT, polished titanium.
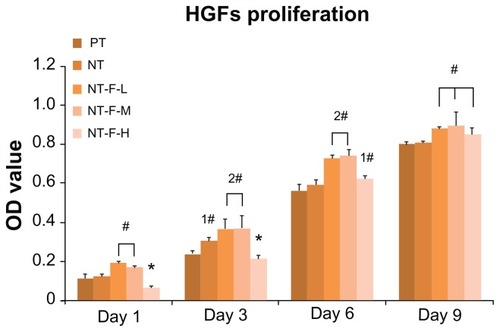
Figure 7 Morphology of HGFs: (A) PT, (B) NT, (C) NT-F-L, (D) NT-F-M, and (E) NT-F-H lacking sufficient prominences/pseudopods and not fusing together.
Abbreviations: HGF, human gingival fibroblast; NT, nanotube; PT, polished titanium.
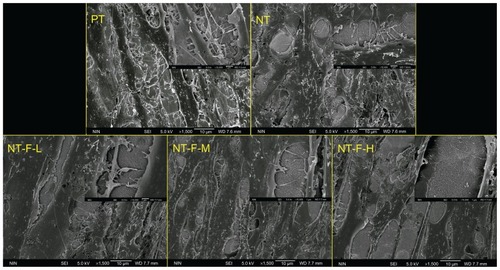
Table 4 Summary of extracellular matrix-related gene expressions on Days 3, 6, and 9
Figure 8 Extracellular matrix-related gene expressions by HGFs cultured on four different titanium surfaces at Days 3, 6, and 9: (A) VEGFA, (B) ITGB, (C) ICAM1, and (D) LAMA1. Inverse concentration-dependent effects of NT-F-H were observed at Day 3 on (C) and (D).
Notes: #Upregulated compared with PT (P < 0.01), *downregulated (P < 0.01), significant difference exists between 1*, 2*, 1#, and 2# (P < 0.01).
Abbreviations: HGF, human gingival fibroblast; ICAM1, intercellular adhesion molecule 1; ITGB, β-integrin; LAMA1, laminin-1; NT, nanotube; PT, polished titanium; VEGFA, vascular endothelial growth factor A.
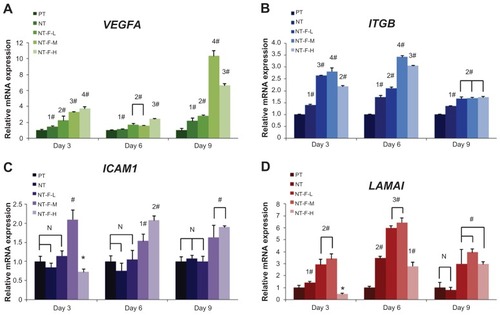
Figure 9 Activity changes of dissolvable FGF2 (10 ng/mL): control (FGF2-free); newly prepared Dulbecco’s modified Eagle’s medium; and S1, S3, S6, and S9 (FGF2 in Dulbecco’s modified Eagle’s medium stored for 1 day, 3 days, 6 days, or 9 days, respectively). The activity of FGF2 reduced gradually in culture medium with time and dropped to less than 50% after 9 days (S9) compared with NP.
Note: #Higher than PT (P < 0.01), significant difference exists between 1#, 2#, and 3# (P < 0.01).
Abbreviations: FGF2, fibroblast growth factor 2; NT, nanotube; OD, optical density; PT, polished titanium.
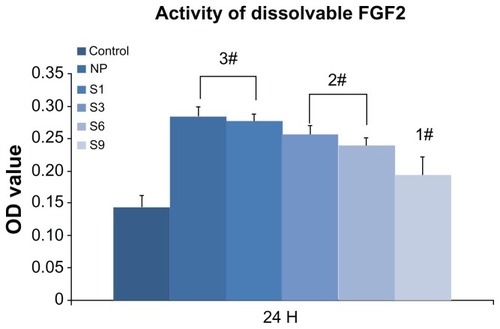
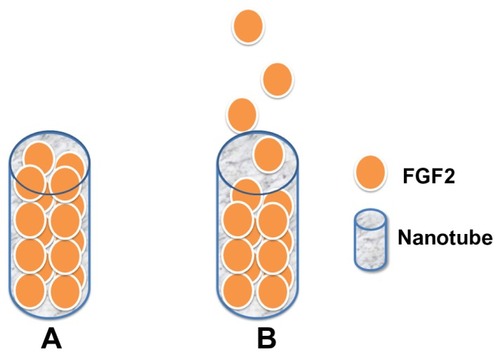
Figure 10 Pattern of nanotube-based FGF2 control release system: (A) initial stage, (B) in culture medium, FGF2 is gradually released from the nanotubes.
Abbreviation: FGF2, fibroblast growth factor 2.