Figures & data
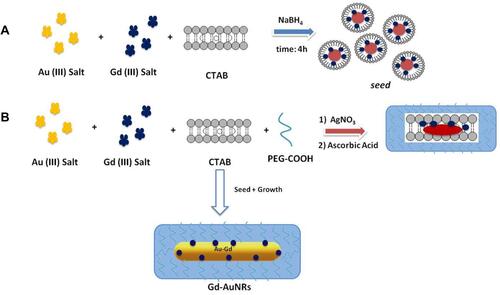
Scheme 1 Schematic representation of seed mediated synthesis of bimetallic nanorods (Gd-AuNRs).
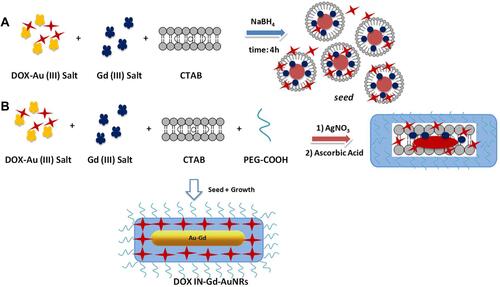
Scheme 2 Chematic representation of seed mediated synthesis of DOX-IN-Gd-AuNRs.
Scheme 3 Schematic representation of Electrostatic Adsorption of DOX onto Gd-AuNRs.
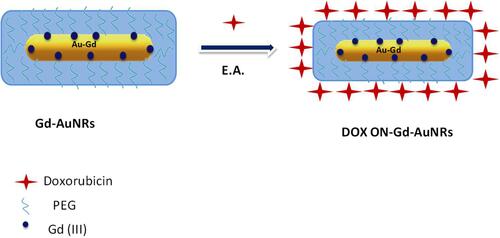
Figure 1 (A) Normalized UV-Vis absorption of GdAuNRs (blackline), DOX IN-Gd-AuNRs (red line) and DOX ON-Gd-AuNRs (blue line); (B) TEM images of Gd-AuNrs (panel 1), DOX IN-Gd-AuNRs (panel 2) and; DOX ON-Gd-AuNRs (panel 3) and (C) their corresponding histogram size distribution; (D) Raman spectra of DOX IN-Gd-AuNRs products (black line) and DOX ON-Gd-AuNRs (red line). Experimental conditions: λexc = 785 nm; laser power 20 mW; accumulation time 180 s.
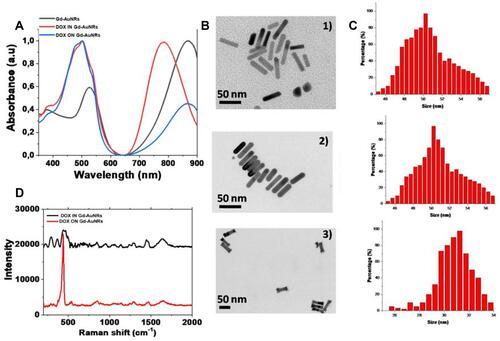
Figure 2 (A) Percentage (%) of DOX released from DOX IN-Gd-AuNRs and (B) DOX ON-Gd-AuNRs overtime in PBS (37°C). Data are reported as average ± standard deviation (n= 3).
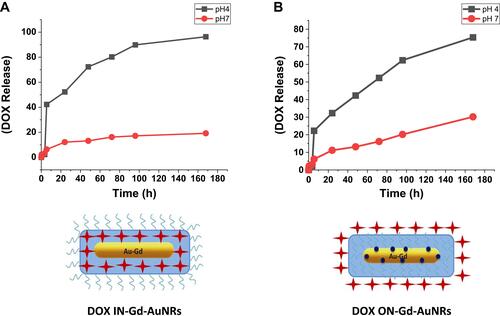
Figure 3 Cytotoxicity MTT tests with two cell lines (MIA PaCa-2, TIB-75); IC50 values are expressed at different concentrations of Au, Gd and DOX. (A) DOX alone; (B) AuNRs; (C) DOX IN –Gd-AuNRs; (D) DOX ON-Gd-AuNRs.
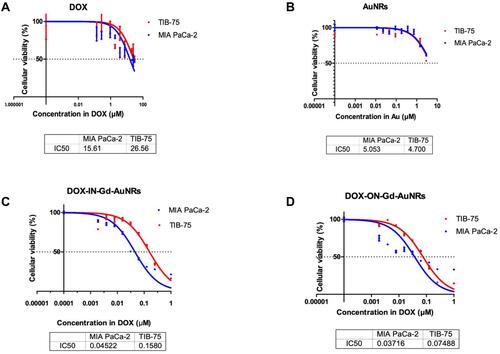
Table 1 IC50 in Two Cell Lines as Function of Au, DOX and Gd3+ Concentration (µm)
Figure 4 Examples of T1 and T2 weighted MR images of Gd-AuNRs: alone (A and B), respectively, DOX IN-Gd-AuNRs (C and D).
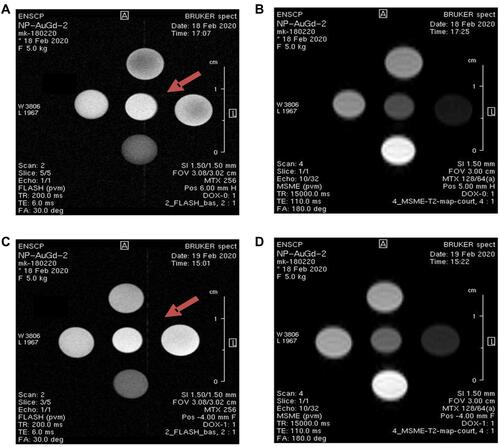
Table 2 Table of R1 and R2 Relaxivities Values Measured at 7T, 273 K, Corrected with the ICP AES Elementary Analysis
Figure 5 Normalized UV−Vis extinction spectra of AuNRs, Gd-AuNRs, DOXI N-Gd-AuNRs and DOX ON-Gd-AuNRs.
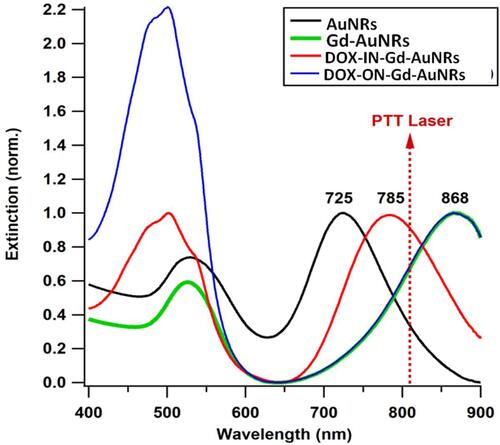
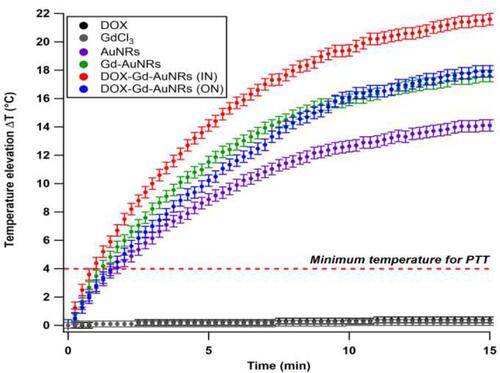
Figure 6 Time-dependant temperature elevation of AuNRs, Gd-AuNRs, DOX IN Gd-AuNRsDOXGd-AuNRs and DOX ON Gd-AuNRs, and control solutions (buffers alone: DOX and GdCl3) under 808 nm laser (0.5 W cm−2). The temperature elevation of NRs is higher than the minimum temperature required for PTT (+4 °C).