Figures & data
Table 1 MICs Values Test (μg/mL)
Figure 1 Characterization of AP-CdSe NPs. (A) UV–vis absorption spectra of AP, CdSe NPs and AP-CdSe NPs. (B) Infrared spectra of AP and AP-CdSe NPs. (C) Fluorescence emission spectra of AP-CdSe NPs at various concentrations (10, 20, 30, 40 and 50 µg/mL) and CdSe NPs (10 µg/mL). (D) TEM images of CdSe NPs and AP-CdSe NPs. (E) DLS of CdSe NPs and AP-CdSe NPs. In the inset, the red arrow points to a AP coated CdSe NPs. (F) Digital images of CdSe NPs (I) and AP-CdSe NPs (II) under bright and UV light.
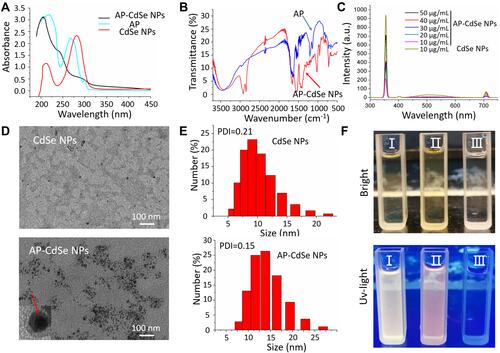
Figure 2 CFU assay of AP-CdSe NPs. Images of bacterial colonies (MDR E. coli and MDR S. aureus) formed on Lysogeny broth-agar plates. PBS was used for the blank group. Corresponding images were graphed using the Origin software. Data are expressed as the mean ± SD (n=9).
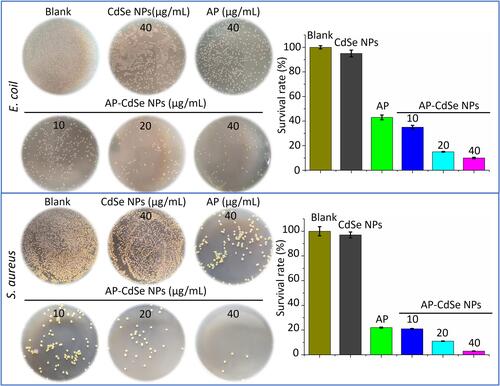
Figure 3 Fluorescence microscopy images of MDR E. coli and MDR S. aureus bacterial culture treated with AP-CdSe NPs at various concentrations (10, 20, 40 µg/mL) for 12 h. The PBS was used for the blank group. The CdSe NPs (40 µg/mL) was set as the control group. Cells were stained with DAPI for 30 min are fluorescent blue, and those stained with AP-CdSe NPs are fluorescent red, while those with fluorescent pink color appearance represent merged images of cells. Fluorescence images were captured using an UV illuminator with a 365 nm emission filter for AP-CdSe NPs and a 461 nm emission filters for DAPI. Scale bar = 10 μm.
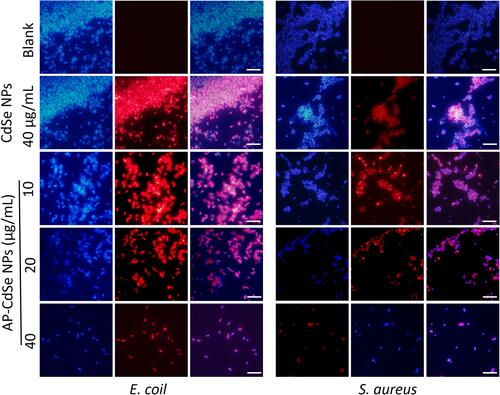
Figure 4 Confocal fluorescence microscopy assay. MDR E. coli and MDR S. aureus, after treatment with AP-CdSe NPs at various concentrations (10, 20, 40 µg/mL). AP solution (40 µg/mL) and CdSe NPs solution (40 µg/mL) were used as control groups. The PBS-treated group was used as blank group. All cells were stained for 30 min with SYTO 9 (green fluorescence) and PI (red fluorescence). Scale bar = 10 μm.
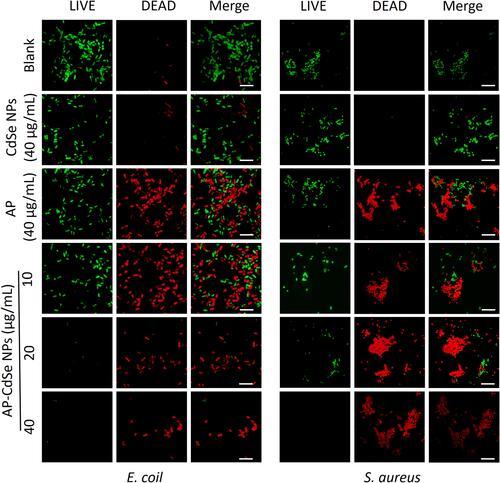
Figure 5 The results of the apoptotic cell death assay by flow cytometry analysis were statistically analyzed by the CytExpert software. MDR E. coli (A)and MDR S. aureus (B), after incubation with AP-CdSe NPs at various concentrations (10, 20, 40 µg/mL). AP solution (40 µg/mL) and CdSe NPs solution (40 µg/mL) were used as control groups. The PBS-treated group was used as blank group. All cells were subsequently briefly (30 min) stained with SYTO 9 and PI. Data are expressed as the mean ± SD (n=3).
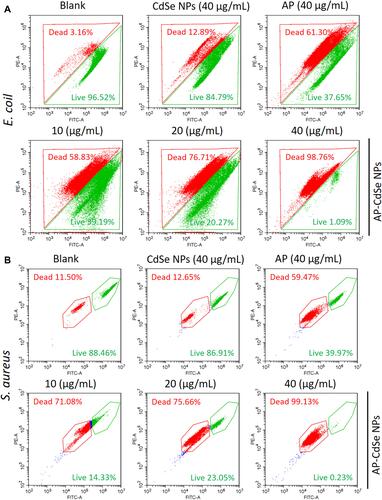
Figure 6 SEM images of MDR E. coli and MDR S. aureus. Bacterial culture treated with AP-CdSe NPs (40 µg/mL). Bacterial culture treated with AP solution (40 µg/mL) and CdSe NPs solution (40 µg/mL) were used as control groups. The PBS-treated group was used as blank group. Green squares indicated the enlarged regions.
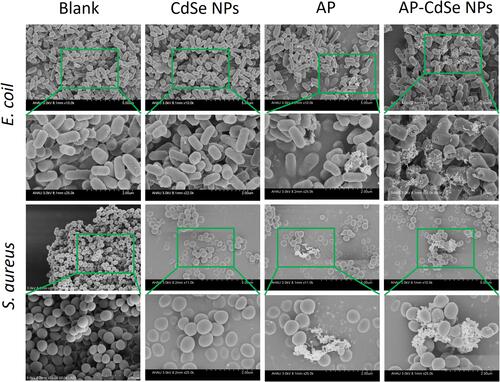
Figure 7 TEM images of MDR E. coli and MDR S. aureus. Cell treated with AP-CdSe NPs solutions at various concentrations (10, 20, 40 µg/mL). Bacterial culture treated with AP solution (40 µg/mL) and CdSe NPs solution (40 µg/mL) were used as control groups. The PBS-treated group was used as the blank group.
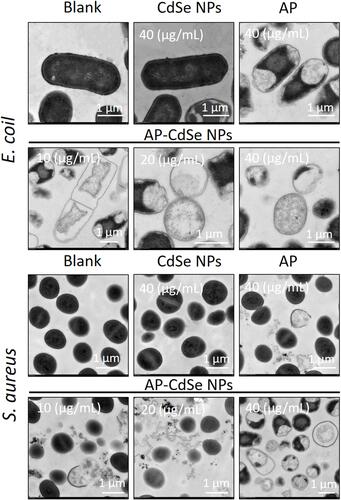
Table 2 The RNASeq Outcomes of Control and AP-CdSe NPs Samples
Figure 8 Differentially expressed genes (DEGs) analyzed in MDR E. coli (AP-CdSe NPs and control). (A) FPKM density distribution of E. coli genes in control and AP-CdSe NPs groups. (B) Number of DEGs comparing the AP-CdSe NPs group with the control group. (C) Gene expression cluster analysis is used to determine the clustering pattern of gene expression in different treatment groups. (D) Pearson correlation coefficient between samples.
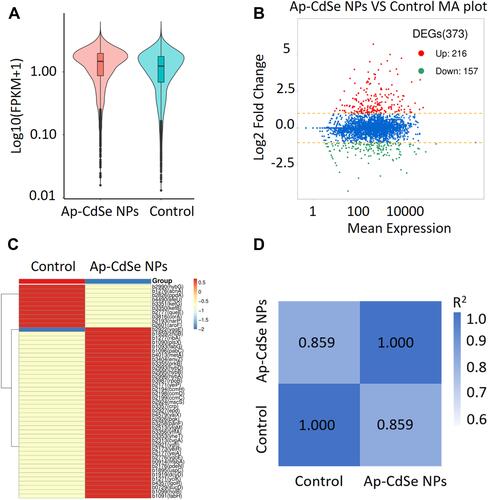
Figure 9 Differentially expressed genes (DEGs) GO enrichment analysis results.
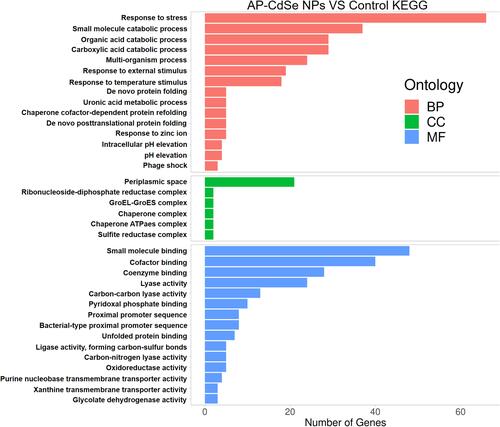
Figure 10 Differentially expressed genes (DEGs) KEGG enrichment analysis results.
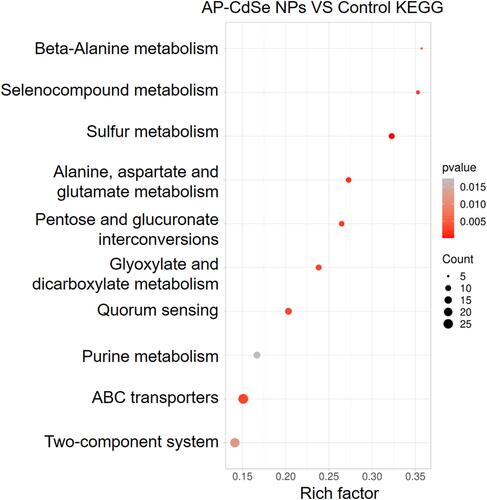
Figure 11 The antibacterial test in the animal bacteremia model. (A) Bacterial count in blood and major organs (heart, liver, spleen, lungs, and kidneys) in blank, infected, and treatment groups. (B) The survival rate and weight of mice were monitored after tail vein injection. (C) Images of H&E-stained tissues of major organs from mice in the blank, infected, and treatment groups.
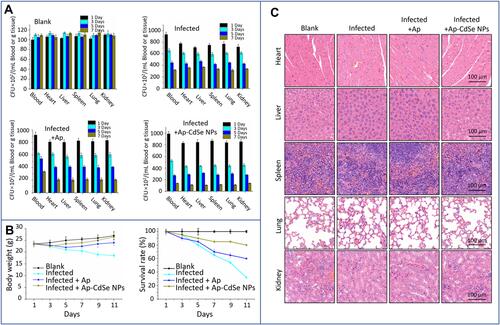
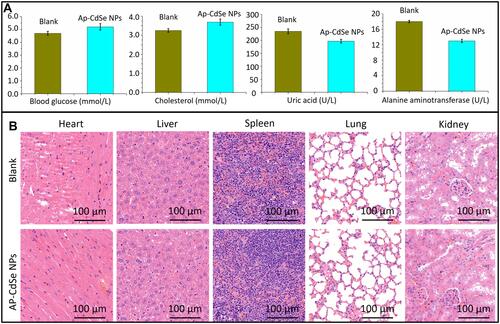
Figure 12 Biosafety evaluation of AP-CdSe NPs. (A) Blood biochemistry, liver function markers (alanine aminotransferase), kidney function markers (Uric acid), blood glucose, and cholesterol were all measured. (B) Histopathological changes in major mouse organs examined by H&E staining.