Figures & data
Figure 1 Comparison of the conventional culture method and the microchip based E. coli detection. (A) Conventional procedure for bacteria detection in clinical facilities. Blood sample collection. (1) Blood samples are incubated in an automated blood culture system. (2) Pathogen or bacteria grown on agar plate are subject to Gram-staining for differentiation between Gram-positive and negative strains. (3) The sample is sub-cultured into a nutrient-rich agar plate for the identification of the species and to determine the bacterial concentration. (B) POC testing approach for rapid detection. Blood sample collection (spiked with GFP-expressing E. coli BL21 stock as a model microorganism). (1) The blood sample is analyzed in microchannels functionalized with E. coli antibodies. E. coli were specifically captured by antibodies on the microchannel surface. (2) Unbound E. coli are washed away with PBS using a syringe micropump. (3) GFP-expressing E. coli are imaged/counted under a fluorescence microscope.
Abbreviations: E. coli, Escherichia coli; GFP, green fluorescent protein; LBP, lipopolysaccharide binding protein; PBS, phosphate buffered saline; POC, point-of-care.
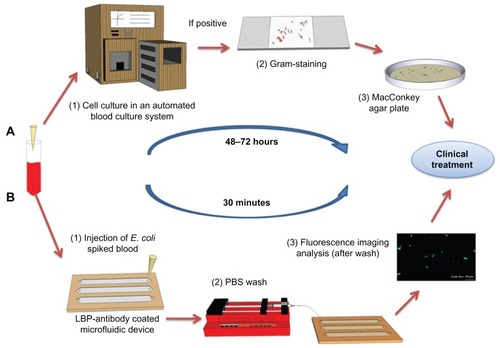
Figure 2 Evaluation of two different surface chemistry methods for E. coli detection on chip. (A) Assembly of the microfluidic chip consisting of PMMA, DSA, and glass cover. Actual image of the assembled microchip containing food dye for visualization. (B) Two antibody immobilization mechanisms were employed, ie, Protein G and NeutrAvidin based surface chemistry. In the first method, biotinylated anti-LBP antibody was immobilized on the microchannel surface via NeutrAvidin. Then, LBP was immobilized on anti-LBP antibody. In the second method, CD14, anti-LPS, or anti-flagellin antibodies was immobilized on the microchannel surface via Protein G. Only CD14 immobilization was illustrated and similar steps were followed for anti-flagellin and anti-LPS. (C) Detection of GFP-tagged E. coli on-chip. To validate the E. coli capture process, and quantify the on-chip concentration and capture efficiency of E. coli, these cells were identified under brightfield (100× magnification) and fluorescence microscopy. (i) Image of the control experiment without E. coli at 10× magnification under a fluorescence microscope. (ii) Image of the capture of GFP-tagged E. coli at 10× magnification under a fluorescence microscope. (iii) Image of the capture of GFP-tagged E. coli at 100× magnification under a fluorescence microscope. (iv) Image of the captured GFP-tagged E. coli at 100× magnification under bright field.
Abbreviations: DSA, double-sided adhesive film; E. coli, Escherichia coli; GFP, green fluorescent protein; LBP, lipopolysaccharide binding protein; LPS, lipopolysaccharide; PBS, phosphate buffered saline; PMMA, poly(methyl methacrylate); POC, point-of-care; GMBS, N-(gamma-maleimidobutyryloxy) succinimide
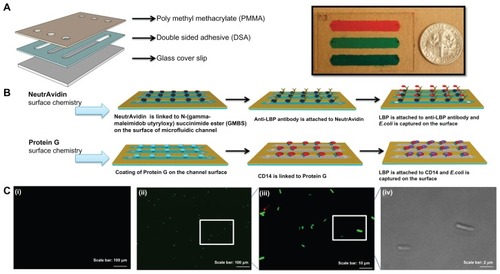
Figure 3 Comparison of the capture efficiency of E. coli by two different surface chemistries and different capturing agents. E. coli were incubated at room temperature for 1 hour. (A) Three different experimental designs (anti-LBP-LBP, anti-LBP-LBP-BSA, and LBP-BSA) were performed on NeutrAvidin based surface chemistry. Three different capture agents were immobilized via Protein G based surface chemistry. The wash flow rate was 2 μL/min. Brackets connecting individual groups indicate statistically significant difference (analysis of Variance with Tukey’s post-hoc test for multiple comparisons, n = 2–6, P < 0.05). (B) Effect of channel flow rate on capture efficiency of E. coli on chip. 75 μL of E. coli was flowed into microchannels. After sample incubation for 15 min at ambient temperature, three different wash flow rates (2, 5, and 10 μL/min) were used to optimize the capture efficiency of E. coli on chip. Statistical analysis indicated that flow rate had a significant effect on capture efficiency (nonparametric Kruskal–Wallis test), where 2 μL/min resulted in significantly greater (P < 0.05) capture efficiency compared to 10 μL/min flow rate. Brackets connecting individual groups indicate statistically significant difference. Data are presented as average ± SEM. Non-parametric upper-tailed Mann–Whitney U test for pair-wise comparisons, n = 3–8, P < 0.05.
Abbreviations: BSA, bovine serum albumin; E. coli, Escherichia coli; LBP, lipopolysaccharide binding protein; SEM, standard error of the mean.
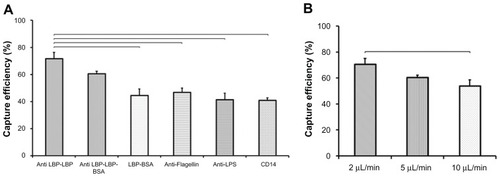
Figure 4 (A) Three different food dye solutions were injected into microchannels before performing wash steps. (B) Images of channels before and after wash steps indicated that food dye was removed from microchannels at a flow rate of 2 μL/minute.
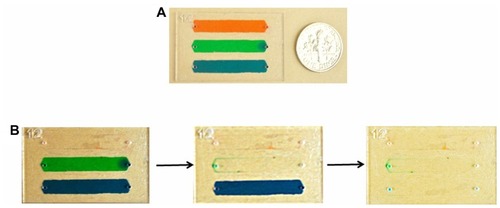
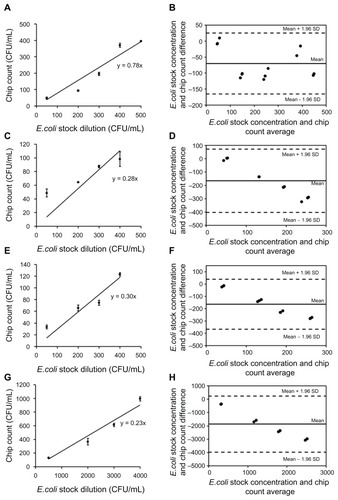
Figure 5 Correlation of E. coli quantification by microchip and LB plating. This experiment was performed to establish the correlation between bacteria cell counts obtained by colony count from LB agar plates and cell count after capture on a microfluidic device (A, C, E and G). Bland–Altman analysis between the microchip count and E. coli stock concentrations did not display an evidence for a systematic bias for chip counts. (A) 75 μL of varying concentrations (up to 500 CFUs/mL) of E. coli spiked in PBS was injected into microchannels functionalized with anti-LBP antibody. For comparison, 75 μL of each concentration of E. coli was plated out on ampicillin containing LB agar plates and incubated overnight. The number of E. coli colonies was counted the next day and compared to the E. coli counted on chip. The detection limit of microchip was found as 50 CFUs/mL. Data are presented as average ± SEM (n = 3) (r = 0.960, P = 0.009). (B) The mean bias for E. coli spiked in PBS was −70 CFUs/mL sample in microchip counts compared to E. coli stock concentrations. (C) Varying concentrations (up to 400 CFUs/mL) of E. coli spiked in blood were injected into microchannels functionalized with anti-LBP antibody and the detection limit of microchip was found as 50 CFUs/mL (r = 0.989, P = 0.011). (D) The mean bias was −165 CFUs/mL of blood in microchip counts compared to E. coli stock concentrations. (E) Varying concentrations (up to 400 CFUs/mL) of E. coli spiked in milk were injected into microchannels functionalized with anti-LBP antibody and the detection limit of microchip was found as 50 CFUs/mL (r = 0.962, P = 0.038). (F) The mean bias was −163 CFUs/mL of milk in microchip counts compared to E. coli stock concentrations. (G) Varying concentrations (up to 4,000 CFUs/mL) of E. coli spiked in spinach were injected into microchannels functionalized with anti-LBP antibody and the detection limit of microchip was found as 500 CFUs/mL (r = 0.977, P = 0.023). (H) The mean bias was −1869 CFUs/mL of spinach sample in microchip counts compared to E. coli stock concentrations. (“r” indicates Pearson product-moment correlation coefficient, “P” indicates the statistical significance of correlation).
Abbreviations: CFU, colony forming unit; E. coli, Escherichia coli; LB, Luria–Bertani; LBP, lipopolysaccharide binding protein; SD, standard deviation; SEM, standard error of the mean.