
Figures & data
Figure 1 Carboxyl-MoS2 nanocomposite synthesis and the sensing mechanism of the carboxyl-MoS2-based SPR biosensor to detect PAPP-A2 protein in maternal serum samples. (A) Schematic diagram of sonication-assisted liquid-phase exfoliation (LPE) for the preparation of MoS2 sheets. (B) MoS2 exhibits a layered structure with planar Mo–S bonds and sulfur vacancies on the MoS2 surface. (C) The carboxyl-MoS2 nanocomposites were successfully modified by chloroacetic acid. Carboxyl-MoS2-based SPR chip immobilization steps and containing. (D) Au film substrate. (E) Cys linker containing a thiol-group to allow for assembly on the Au film substrate. (F) Covalent binding of carboxyl-MoS2 on the Cys-linker. (G) EDC/NHS activated carboxyl groups resulting in a higher density of immobilized antibodies. (H) To detect PAPP-A2 protein to screen for Down’s syndrome in maternal serum samples.
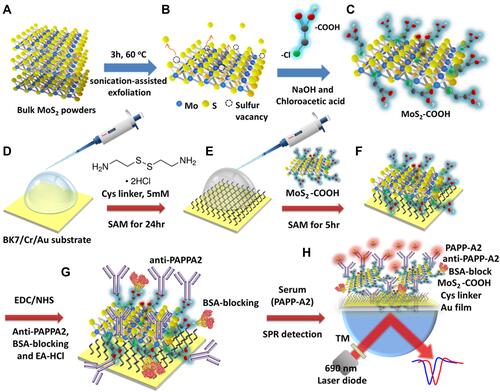
Figure 2 (A) SEM image of carboxyl-MoS2 sheets. (B) Cross-sectional SEM image of lateral flake thickness of carboxyl-MoS2 sheets. (C) TEM image of the carboxyl-MoS2 sheets. (D) TEM image of the MoS2 sheets. (E) EDS analysis of the carboxyl-MoS2 sheets (insert shows the carboxyl-MoS2 sheet for the EDS analysis).
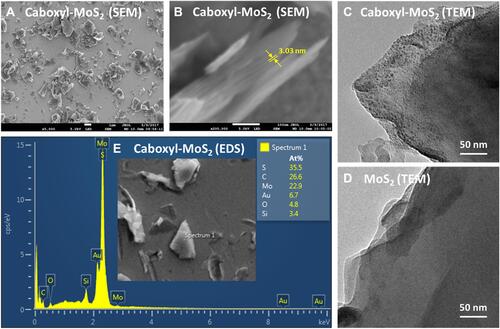
Figure 3 The XPS survey spectra of (A) MoS2 sheets and (B) carboxyl-MoS2 sheets. The high-resolution XPS spectra of (C) C1 2p, (D) Mo 3d, (E) S 2p for MoS2 and carboxyl-MoS2 sheets. (F) Analysis of XPS surface atomic intensity ratios of C1s/Mo3d and O1s/Mo3d on MoS2 and carboxyl-MoS2 sheets.
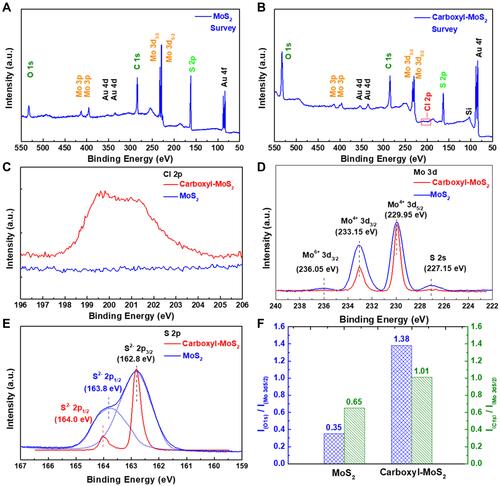
Figure 4 High energy resolution XPS spectra of (A) C1s and (B) O1s regions on carboxyl-MoS2 sheets. (C) UPS spectra of different interfaces of Au, Au/MoS2 and Au/carboxyl-MoS2 film. Band diagram of (D) Au/MoS2 and (E) Au/carboxyl-MoS2 heterojunctions obtained from UPS measurements. The band-gap energies used in the diagram are optical gaps.
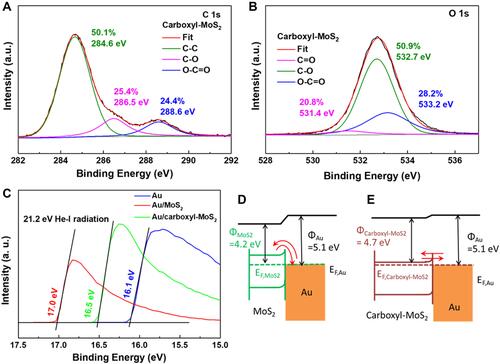
Figure 5 (A) Optimization of the immobilization process of antibodies in carboxyl-MoS2-based SPR chips. (B) Non-specific molecular dissociation reactions were tested using PBS and PBSBNT buffer, respectively.
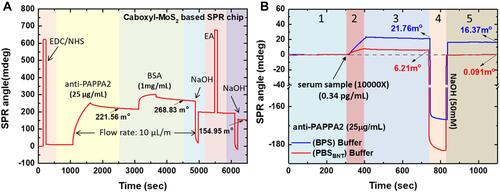
Figure 6 Sensorgrams showing the SPR responses generated with a flow rate of 60 μL/min and different dilution factors of 10 FDS maternal serum samples. The 10 FDS samples were derived from blood drawn at a gestational age of (A) 19, (B) 20, (C) 14, (D) 14, (E) 22, (F) 19, (G) 21, (H) 18, (I) 19, and (J) 18 weeks, respectively.
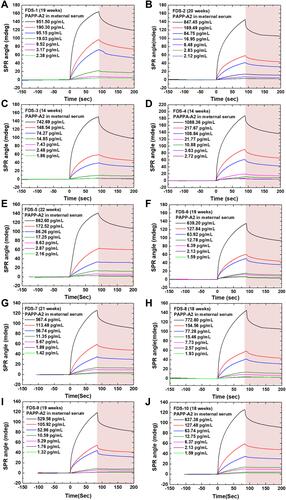
Figure 7 Sensorgrams showing the SPR responses generated with a flow rate of 60 μL/min and different dilution factors of maternal serum samples from four healthy women (NPW group). The NPW samples were derived from blood drawn at a gestational age of (A) 14, (B) 12, (C) 14, and (D) 16 weeks, respectively.
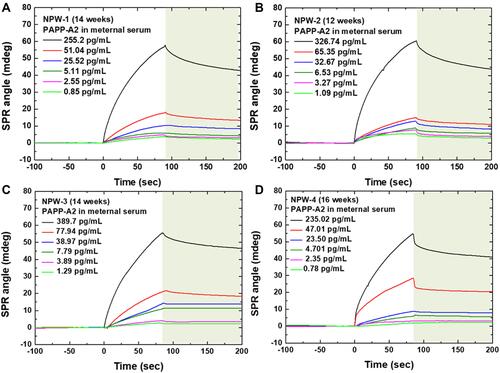
Figure 8 Calibration curves obtained with (A) ELISA kit assays for PAPP-A2 quantification ranging from 2.5 to 108 ng/mL. (B) Calibration curve of the average SPR response to various PAPP-A2 concentrations ranging from 0.1 to 1100 pg/mL with the carboxyl-MoS2-based SPR chip. Error bars indicate standard deviations of means obtained from three replicates using SPR and three replicates using ELISA. Correlation between the concentration of PAPP-A2 in serum obtained by ELISA and signal responses by SPR. (C) NPW group (n = 24, R2 = 0.97) and (D) FDS group (n = 60, R2 = 0.91) samples.
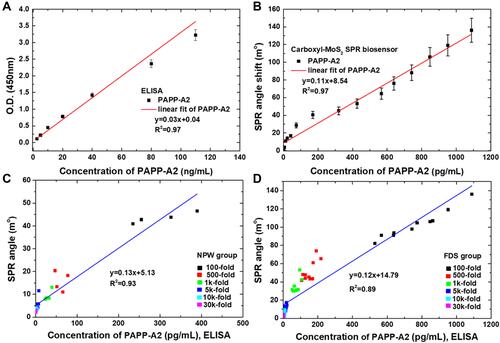
Figure 9 SPR responses of serum samples of the FDS and NPW groups. (A) Kinetic analysis of the FDS and NPW groups on the carboxyl-MoS2-based SPR biosensor for affinity binding analysis of the PAPP-A2 interaction. (B) Correlation between two variables of the FDS and NPW groups to detect PAPP-A2 in serum samples. Data expressed as mean ± SD for triplicate tests. Asterisks indicate statistical significance using a generalized mixed effects model (highly significant recognition (***) (p < 0.001); very significant recognition (**) (0.001 < p < 0.01); significant recognition (*) (0.01 < p < 0.05). p: probability value). (C) The dot plot shows the distribution of SPR responses at the dilution rate (100-, 500-, and 1k-fold) of different serum samples and the difference between the FDS and NPW groups at the cut-off limit for screening. (D) Recovery rates of PAPP-A2 protein assay in the FDS group using the carboxyl-MoS2-based SPR chip.
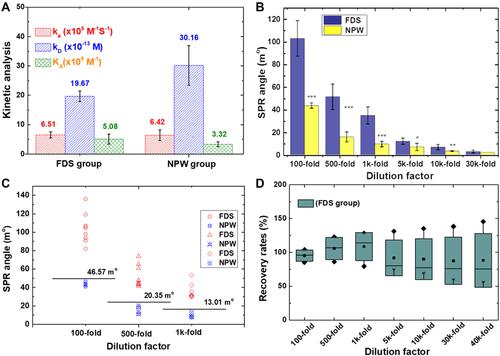
Table 1 Comparison Between the FDS and NPW Clinical Samples