Figures & data
Figure 1 Physicochemical characteristics of TAgNPs were determined. (A) An electron micrograph shows the triangular structure of TAgNPs. (B) The UV-Vis spectrum of a 6.25 µg/mL TAgNPs in water is shown. (C) The hydrodynamic and (D) ζ-potential of 6.25 µg/mL TAgNPs in water are shown. Data in c and d are representative of triplicate independent measurements, and mean values with standard deviations are displayed.
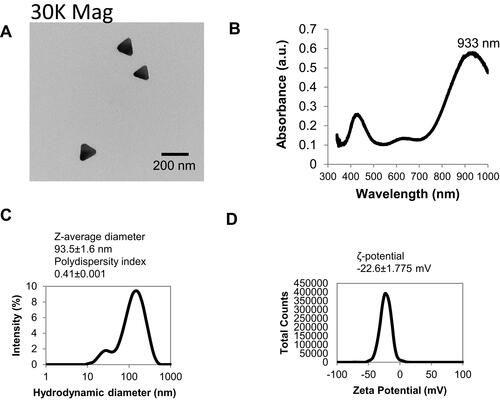
Figure 2 TAgNPs are more cytotoxic to TNBC than to non-malignant mammary epithelial cells. (A) Relative viability of MCF-10A and MDA-MB-231 after 72-hour treatment with TAgNPs (0–50 µg/mL). Viability was assessed by MTT assay. Data is representative of at least 3 independent experiments. Statistical analysis was performed by two-way ANOVA followed by post hoc Tukey’s test. Statistical differences are indicated (*p<0.05; **p<0.01). (B) The dose per unit area in comparison to the concentration of TAgNPs was calculated for various well sizes and is shown in tabular form. (C) MDA-MB-231 and (D) MCF-10A cells were treated with 12.5 µg/mL TAgNPs for 24 hours. Cells were co-stained with propidium iodide (PI) and annexin V (AnnV), and then evaluated by flow cytometry. The percentages of cells characterized as viable (lower-left quadrant), early apoptotic (lower-right quadrant), late apoptotic (upper-right quadrant) and necrotic (upper-left quadrant) are shown with each quadrant. The presented data are representative of duplicate independent experiments.
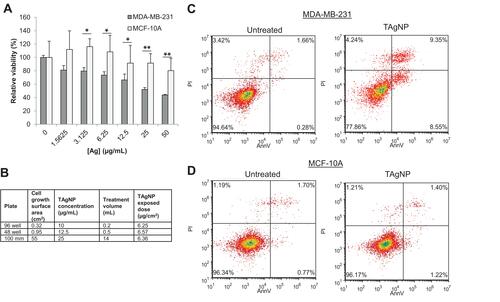
Figure 3 NIR radiation enhances TAgNP cytotoxicity in TNBC cells. (A) Cell culture media containing various concentrations of TAgNPs was exposed to NIR at a fixed power and duration (3 W for 60 s at a 950 nm wavelength) and change in temperature (ΔT) was assessed. (B) 12.5 µg/mL TAgNPs were exposed to NIR at varying power (1.5 W to 9.0 (W) for 60 seconds and ΔT was assessed. (C) Cell culture media containing a fixed concentration of TAgNPs (12.5 µg/mL) was exposed to NIR for increasing durations at a fixed power (3 (W) and ΔT was assessed. (D–E) MCF-10A and MDA-MB-231 cells were treated with TAgNPs and irradiated with a 3 W, 970 nm NIR laser for increasing amounts of time (0–90 s) and cell viability was assessed 72 hours later by MTT assay. MCF-10A and MDA-MB-231 cells treated with 0 µg/mL (D), 6.25 µg/mL (E), or 12.5 µg/mL (F) doses of TAgNP and irradiated with an NIR laser. Temperature measurements shown in (D–F) were made in a separate set of wells under identical treatment, and the final temperatures achieved are shown. Values are reported as the mean ± standard deviation of triplicate measurements relative to the untreated control for each cell line. Statistical analysis was performed by two-way ANOVA followed by post hoc Tukey’s test. Significant differences are indicated (*p<0.05; **p<0.01). ns: not significant. The presented data are representative of duplicate independent experiments.
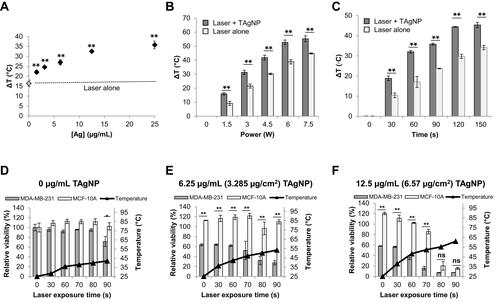
Figure 4 Uptake and trafficking of TAgNPs visualized by TEM. (A) Electron micrographs show degraded particles in multivesicular bodies and amphisomes in MDA-MB-231 cells after 3 hours at 11000X magnification (left) or 30000X magnification (right). (B) Electron micrographs show degraded particles in endosomes in MCF-10A cells after 3 hours at 11000X magnification (left) or 30000X magnification (right). EN, endosome; AM, amphisome; LY, lysosome; MVB, multivesicular body.
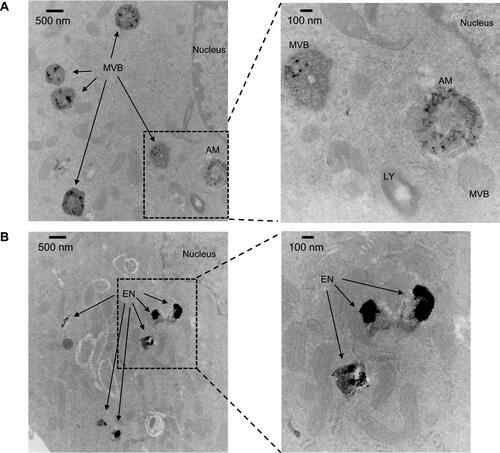
Figure 5 IR enhances TAgNP cytotoxicity in TNBC. (A) Long-term proliferative potential was assessed via clonogenic assay in MDA-MB-231 and MCF-10A cell lines following TAgNP treatment (0–5 µg/mL). (B, C) Long-term proliferative potential was assessed via clonogenic assay with increasing doses of IR (0–4 Gy) following 24 h TAgNP treatment in (B) MDA-MB-231 and (C) MCF-10A cells. The combination index (CI) of IR and TAgNPs treatment of each cell line are shown in the tables on the right. The data are presented as the surviving fraction of cells based upon clonogenic growth normalized to the plating efficiency of cells exposed to the relevant dose of AgNPs in the absence of ionizing radiation. Values are reported as the mean ± standard deviation of triplicate measurements relative to the untreated control for each cell line. Statistical analysis was performed using two-way ANOVA followed post hoc Tukey’s test. Significant differences are indicated (*p<0.05; **p<0.01). The presented data are representative of duplicate independent experiments.
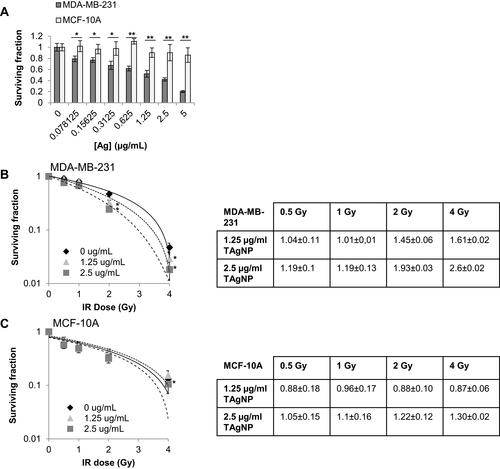
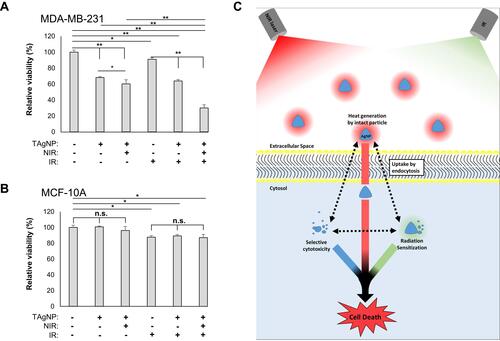
Figure 6 TAgNP-based trimodal treatment is highly cytotoxic to TNBC cells. MDA-MB-231 (A) and MCF-10A (B) cells were treated with 10 µg/mL TAgNPs for 3 hours followed by exposure to NIR laser for 60 s and IR (0–2 Gy). Cells were then allowed to incubate with TAgNPs for 72 hours. After 72 hours, cell viability was assessed by MTT assay. Each condition was normalized to the untreated control for each cell line and is reported as the mean of six replicates ± standard deviation. Results are representative of two independent experiments. Statistical analysis was performed by two-way ANOVA followed by post hoc Tukey’s test. Significant differences are indicated (*p<0.05; **p<0.01). The presented data are representative of duplicate independent experiments. (C) A schematic representation of thermoradiosensitization using TAgNPs is shown. Intact nanoparticles in the extracellular space generate heat when exposed to a NIR laser. A portion of TAgNPs are taken up by cells and are partially degraded. Internalized TagNPs are cytotoxic to TNBC cells and act as IR and thermal sensitizers. Hyperthermia also sensitizes the cells to IR. Under optimal conditions, these three modalities combine to selectively induce TNBC cell death, while having little effect on non-malignant mammary epithelial cells.