Figures & data
Figure 1 A hypothetical two-compartment model of drug metabolite quantification to compare the in vivo hepatic blood situation and plasma circulation, with special reference to drug metabolite detection during biotransformation. (A) matrix phase (inside the human hepatocytes: Compartment I) compared to the interior of the in vivo hepatocyte cells and (B) supernatant (Compartment II) compared to blood plasma, as in vivo hepatocytes have direct contact with human plasma – hepatocytes can extract oxygen and nutrients and detoxify chemicals in the plasma, and their metabolites pass into the plasma.
Note: Preclinical drug screening assessment tests that utilize this two-compartment strategy may facilitate safer registration of new drug candidates.
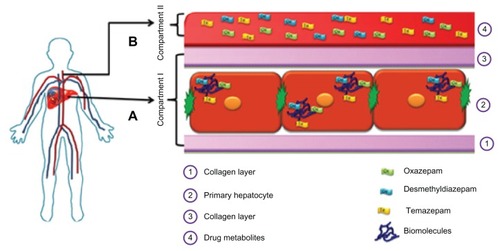
Figure 2 The pig liver is closer to human liver anatomy than rat or mouse liver.
Notes: Therefore, we investigated the drug metabolism of diazepam and its metabolites in both human and porcine hepatocytes. It is widely accepted that the porcine hepatocyte is the best nonhuman model to use as an alternative to human hepatocytes, due to shortages or unavailability of human hepatocytes.
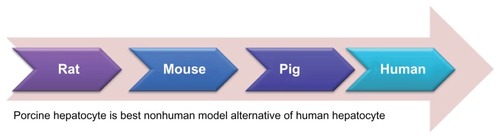
Figure 3 Timeline for diazepam metabolism experiment in human hepatocytes.
Notes: On Day 0, cells are isolated and placed on a dish precoated with collagen. Two days after the insulation, a second collagen layer is added to make the organotypic sandwich cellular model. The experiment begins on Day 3, with different incubation times. The experiment was performed three times at different isolations. Number of dishes per time point, n = 3 per experiment.
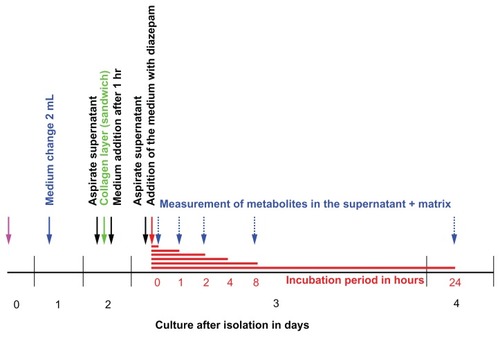
Figure 4 Timeline for diazepam metabolism experiment in primary porcine hepatocytes.
Notes: On Day 0, the isolation was performed. Two days later, the cells were coated with the second layer of collagen. On the third day, the experiment took place at different incubation times. The experiment was conducted four times at different isolations. Number of dishes per time point, n = 3 per experiment.
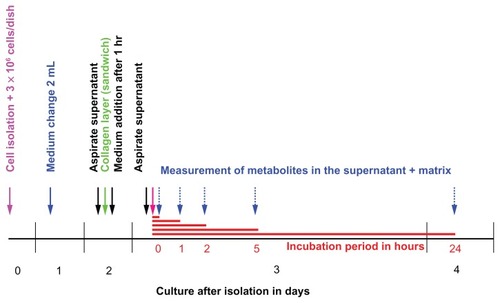
Figure 5 Time course and concentration in the matrix and in the supernatant of primary human hepatocytes of (A) diazepam; (B) desmethyldiazepam; (C) temazepam metabolites; and (D) oxazepam metabolites.
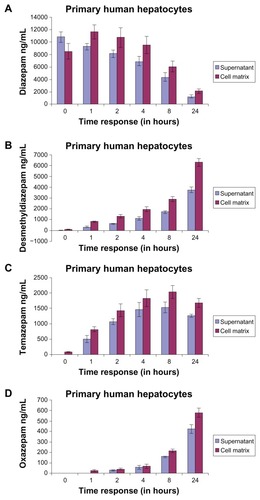
Figure 6 Representation of diazepam metabolism status at different exposure time points in primary human hepatocytes in (A) the supernatant, and (B) the matrix.
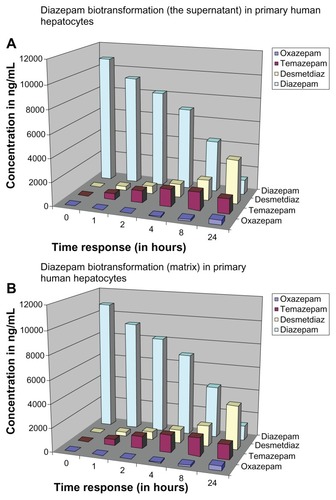
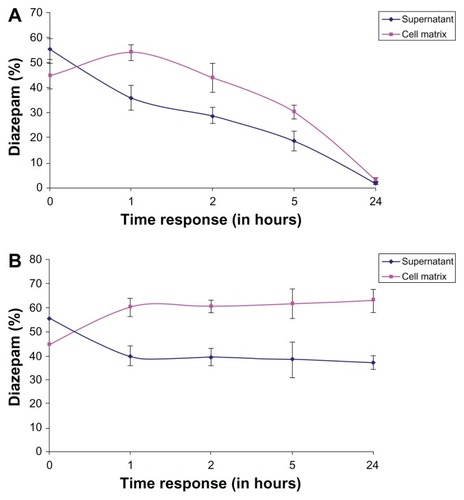
Figure 7 (A) Percentage representation of diazepam in the matrix and the supernatant at different exposure times in relation to the sum of matrix + supernatant content in the human hepatocytes. (B) Percentage representation of diazepam in the matrix and the supernatant at different exposure times in relation to the sum of matrix + supernatant content in the porcine hepatocytes.
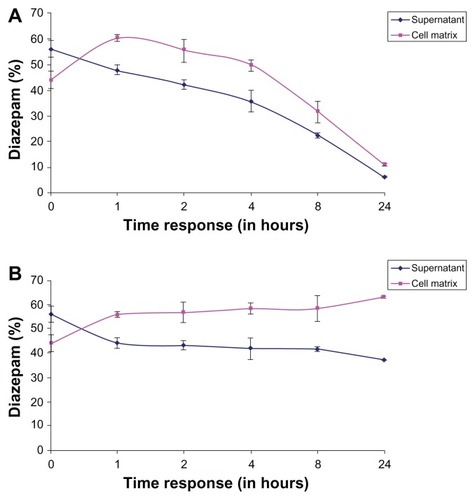
Figure 8 Time course and concentration of diazepam in the matrix and in the supernatant of (A) primary porcine hepatocytes; (B) desmethyldiazepam metabolites; (C) temazepam metabolites; and (D) diazepam oxazepam.
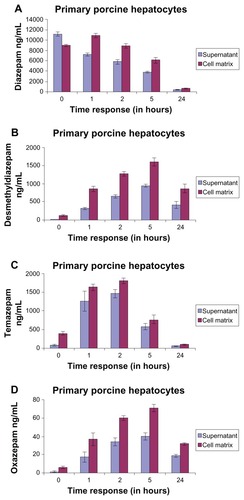
Figure 9 Representation of diazepam metabolism status at different exposure time points in primary porcine hepatocytes in (A) the supernatant and (B) the matrix.
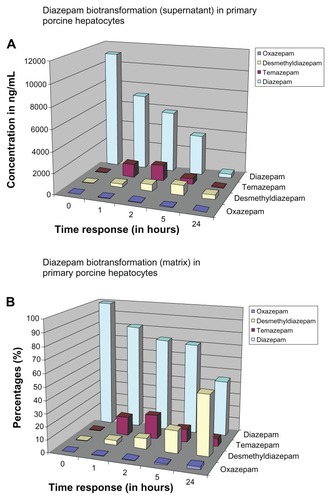
Figure 10 (A) Percentage representation of diazepam in the matrix and the supernatant at different exposure times in relation to the sum of matrix + supernatant content in the human hepatocytes. (B) Percentage representation of diazepam in the matrix and the supernatant at different exposure times in relation to the sum of matrix + supernatant content in the porcine hepatocytes.