Figures & data
Table 1 Microstructure and Composition of Various Developed Formulations of Finasteride Nanosystems
Figure 1 Solubility of finasteride in oils and emulgents. Experiments were carried out in triplicate (n=3). Error bar shows standard deviation. Level of significance was determined using Student’s t-test (p<0.05).
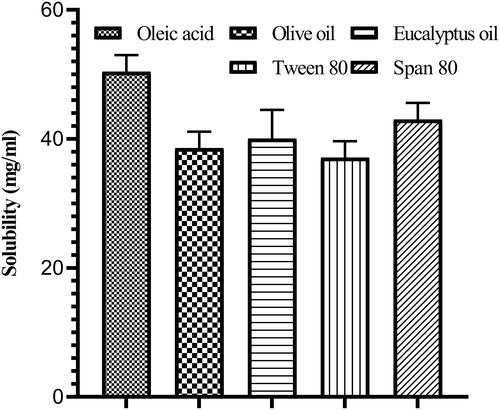
Table 2 Physicochemical Characteristics of Finasteride Nanosystems
Figure 2 TEM images of nanosystems. (I) Blank nanosystem (F0). (II) Undecorated finasteride nanosystem (FNS-NS) (F1). (III) 0.125% FNS-NS (F2). (IV) 0.25% FNS-NS (F3). (V) 0.5% FNS-NS (F4). (VI) 1% FNS-NS (F5).
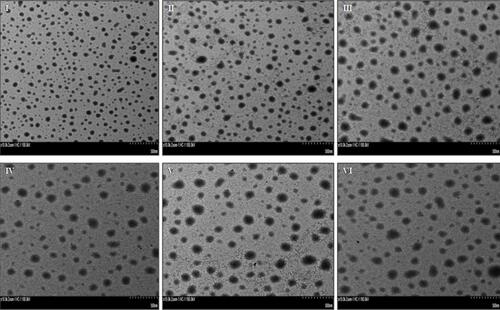
Figure 3 In vitro release profile of finasteride nanosystems. Experiments were performed in triplicate (n=3). Error bar shows standard deviation. Level of significance was determined by one-way ANOVA (p<0.05).
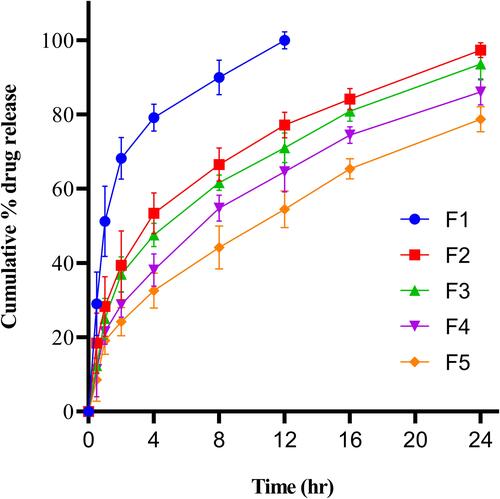
Table 3 Drug Release Kinetics
Figure 4 Ex vivo permeation of finasteride through rat skin. Experiments were performed in triplicate (n=3). Error bar shows standard deviation. Level of significance was determined by one-way ANOVA (p<0.05).
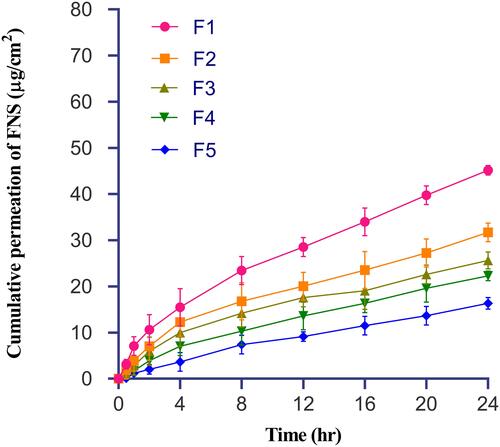
Table 4 Finasteride Nanosystem Patterns of Drug Release, Permeation, Flux and Drug Retention
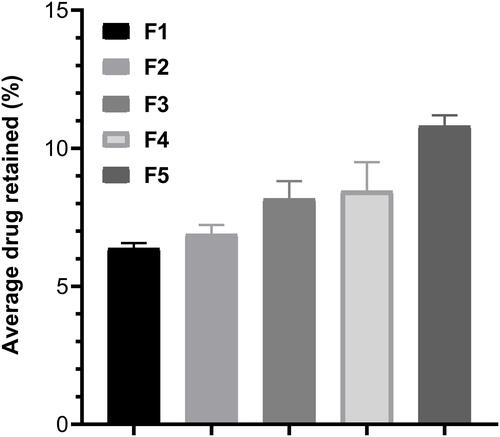
Figure 5 Finasteride skin deposition profile. Experiments was performed in triplicate (n=3). Error bar shows standard deviation. Level of significance was determined using Student’s t-test (p<0.05).