Figures & data
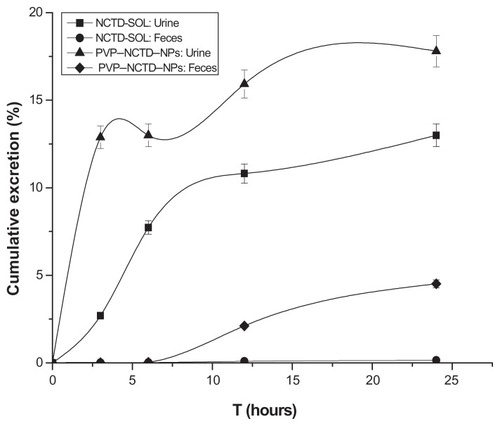
Figure 1 XRD pattern of NCTD and PVP–NCTD–NP nanoparticles.
Abbreviation: XRD, X-ray diffraction.
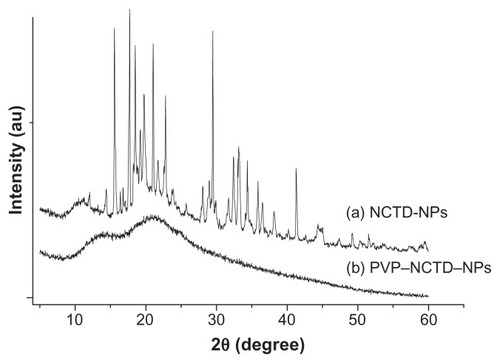
Figure 2 AFM ichnography of NCTD-NPs and PVP–NCTD–NPs.
Notes: 1: nanoparticles without PVP; 2: nanoparticles with PVP.
Abbreviation: AFM, atomic force microscopy.
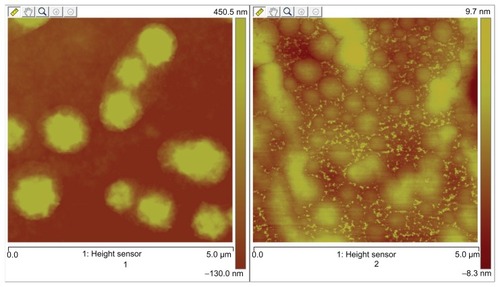
Figure 3 AFM image of PVP–NCTD–NPs.
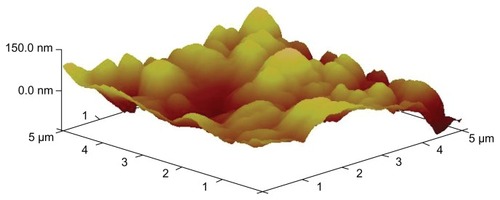
Table 1 Pharmacokinetic parameters of two formulations after intravenous and oral administrations to rats
Figure 4 Mean plasma concentration profiles of NCTD after intravenous administration of two formulations at 5 mg/kg to SD rats (N = 6).
Abbrevations: SD, Sprague-Dawley; CNCTD, concentration of NCTD; T, time.
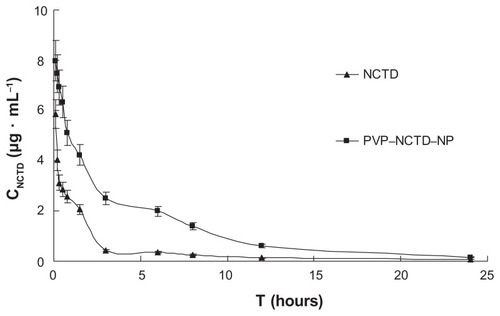
Figure 5 Mean plasma concentration profiles of NCTD and PVP–NCTD–NP after oral administration of 5 mg/kg to SD rats (N = 6).
Abbrevations: CNCTD, concentration of NCTD; T, time.
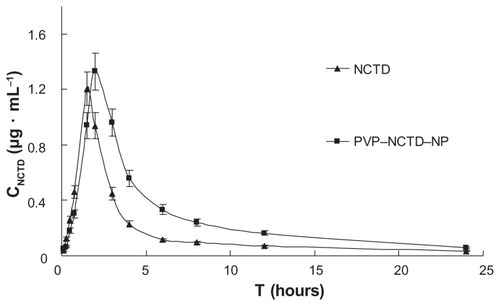
Table 2 Te, RTe, and TI of NCTD and PVP–NCTD–NPs after intravenous administration
Figure 6 Tissue distribution of NCTD-SOL and PVP–NCTD–NPs after intravenous administration in mice (N = 6).
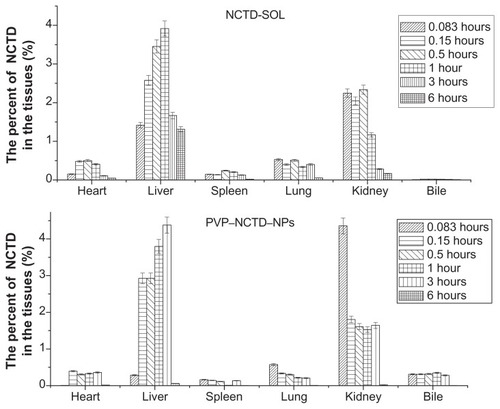
Figure 7 Product ion spectra of NCTD and its metabolites in rats.
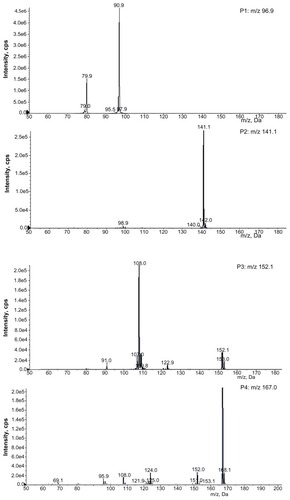
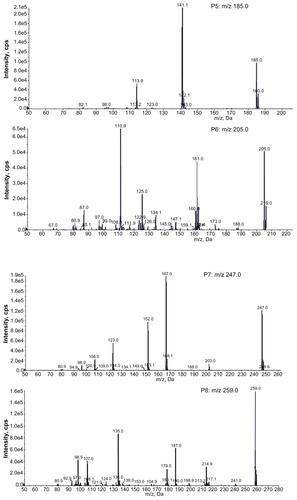
Figure 8 Structures of the main metabolites and their possible transformation in rats.
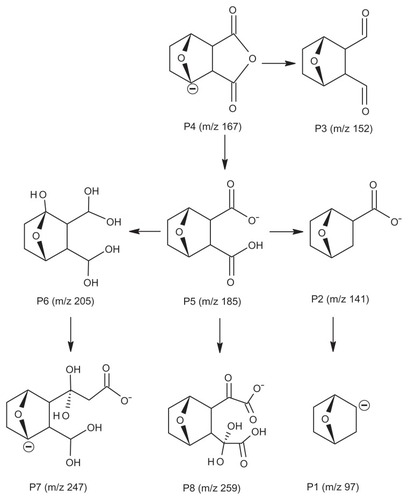
Figure 9 Cumulative amounts of excreted NCTD in urine and feces: time curves after oral administration of NCTD and PVP–NCTD–NP to rats (N = 6).