Figures & data
Figure 1 (A) Lipidic nanocapsule; (B) lipidic nanocapsule labeled with FITC, and (C) lipidic nanocapsule with rolipram encapsulation and FITC label.
Abbreviations: DSPE-PEG2000-amino, 1,2-distearoyl-sn-glycero-3-phosphoethanolamine-N-[amino(PEG)2000]; FITC, fluorescein isothiocyanate.
![Figure 1 (A) Lipidic nanocapsule; (B) lipidic nanocapsule labeled with FITC, and (C) lipidic nanocapsule with rolipram encapsulation and FITC label.Abbreviations: DSPE-PEG2000-amino, 1,2-distearoyl-sn-glycero-3-phosphoethanolamine-N-[amino(PEG)2000]; FITC, fluorescein isothiocyanate.](/cms/asset/abf46bef-cea1-4c7e-9a0e-bce0988d4903/dijn_a_29712_f0001_c.jpg)
Figure 2 Representative midmodiolar hematoxylin and eosin-stained section (5 μm) of a deafened guinea pig cochlea. Rosenthal’s canal areas are highlighted in red squares. Lower basal turn (lb), upper basal turn (ub), first middle turn (1 m), second middle turn (2 m), third middle turn (3 m), fourth middle turn (4 m), and apical turn (a) of the scala tympani are labeled. The arrow marks the cochleostomy where the solutions were injected into the scala tympani. The modiolus, the axis of the inner ear, and the apex, the upper part of the inner ears are marked.
Note: *scala media.
Abbreviations: AN, auditory nerve; M, modiolus; Sc. tymp, scala tympani; Sc. vest, scala vestibuli (magnification: 40-fold).
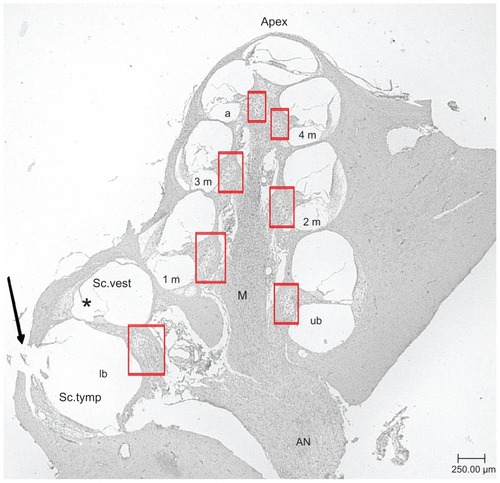
Figure 3 (A) Survival rates of cultured SGC treated with LNC–FITC, LNC–FITC– rolipram, rolipram, and BDNF in different concentrations. Rolipram was used in concentrations of 38 ng (1:50 dilution; n = 5; total: 20 wells), 19 ng (1:100 dilution; n = 5; total: 20 wells), 9.5 ng (1:200 dilution; n = 5; total: 20 wells), and 6.3 ng (1:300 dilution; n = 5; total: 20 wells) per 0.1 mL medium. Stock solution of LNC contained 45 mg/mL FITC (4.2 × 10¹⁵ LNC/mL). LNC–FITC–rolipram particles contained 19 μg/mL rolipram. BDNF (50 ng/mL, n = 5; total: 30 wells) served as positive control. (B) Neurite outgrowth of cultured SGC treated with LNC–FITC, LNC–FITC– rolipram, rolipram, and BDNF in different concentrations (mean ± SD). LNC–FITC 1:50 decreased the SGC–neurite length highly significantly (P < 0.001) compared to all other experimental groups (not marked in the graph) except the LNC–FITC– rolipram 1:50 group (P < 0.01; left upper line). Significant differences among treatment groups compared to the negative control are marked above the columns.
Notes: *P < 0.05; **P < 0.01; ***P < 0.001.
Abbreviations: BDNF, brain-derived neurotrophic factor; FITC, fluorescein isothiocyanate; LNC, lipidic nanocapsules; SD, standard deviation; SGC, spiral ganglion cells.
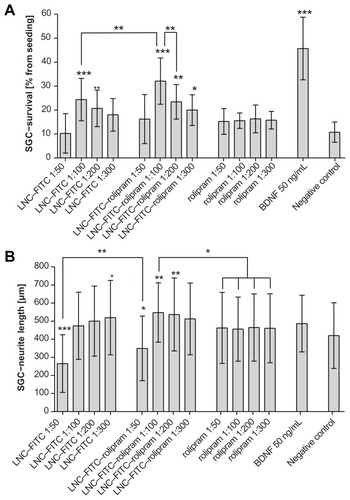
Figure 4 Survival rates of cultured SGC treated with LNC–FITC and LNC–Blank in different concentrations (n = 9 for each group, mean ± SD). Stock solution of LNC contained 45 mg/mL FITC (4.2 × 10¹⁵ LNC/mL). BDNF (50 ng/mL, n = 9) served as positive control. The SGC survival rate of all experimental groups differed significantly from the survival rates of neurons treated with BDNF (upper horizontal line; *P < 0.05; **P < 0.01; ***P < 0.001). Statistically significant differences of LNC (with and without FITC)-treated SGC compared to the negative control are marked above the respective column.
Abbreviations: BDNF, brain-derived neurotrophic factor; FITC, fluorescein isothiocyanate; LNC, lipidic nanocapsules; SD, standard deviation; SGC, spiral ganglion cells.
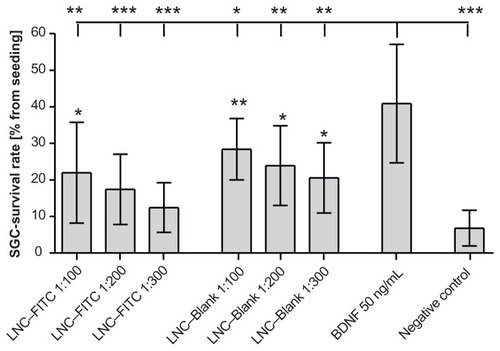
Table 1 Results of the measured soma diameter of SGC (mean ± SD) after 48 hours cultivation with LNC–FITC, LNC– FITC–rolipram, rolipram, or BDNF in the shown concentrations
Figure 5 TNF-α-secretion of DCs treated with rolipram, LNC–FITC–rolipram, LNC–Blank, and LNC–FITC in different concentrations. DC were stimulated with LPS 1 hour after incubation with the test substances. Data show mean ± SD from three independent experiments: each consisted of n = 12 wells per concentration per group. Statistically significant differences in TNF-α secretion compared to the LPS-control group are plotted above the columns.
Notes: *P < 0.05; **P < 0.01; ***P < 0.001.
Abbreviations: BDNF, brain-derived neurotrophic factor; DC, dendritic cells; FITC, fluorescein isothiocyanate; LNC, lipidic nanocapsules; SD, standard deviation; SGC, spiral ganglion cells; TNF-α, tumor necrosis factor-α.
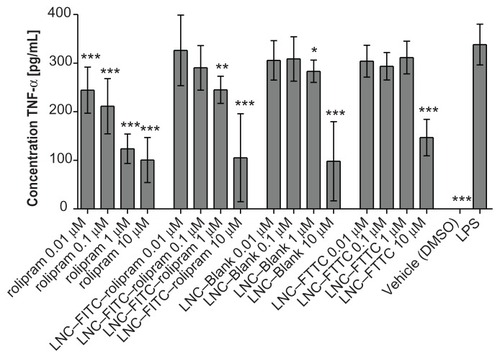
Figure 6 (A) Mean SGC density (cells/10.000 μm2) of deafened guinea pigs treated with LNC–FITC (n = 7), LNC–FITC–rolipram (n = 6), rolipram (n = 7), and PBS (n = 6) in 1:100 dilution (mean ± SD; *P < 0.05). (B) Mean SGC soma diameter of deafened guinea pigs treated with LNC–FITC, LNC–FITC–rolipram, rolipram, and PBS in 1:100 dilution (mean ± SD; *P < 0.05; **P < 0.01). Only LNC–FITC- and rolipram-treated animals showed a significant difference in SGC soma diameters between left (le, test substance) and right (ri, control).
Abbreviations: FITC, fluorescein isothiocyanate; LNC, lipidic nanocapsules; PBS, phosphate-buffered saline; SD, standard deviation; SGC, spiral ganglion cells.
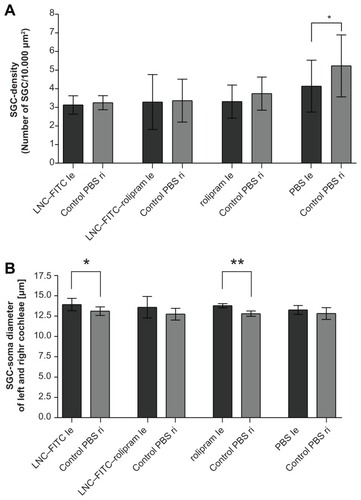
Figure 7 (A–D) Representative images of guinea pigs’ Rosenthal’s canals 21 days after deafening. (E) illustrates the SGC density in normal hearing animals as compared to the deafened ones in (A–D) (the picture is from a previous experiment registered at LAVES with the same registration number as the experiments described here: 07/1266). (A) is from an animal from the LNC–FITC group receiving the nanoparticle in a 1:100 dilution (stock solution 45 mg/ml LNC). (B) represents the Rosenthal’s canal of animals treated with LNC–FITC–rolipram (1:100 dilution of 45 mg/mL LNC and 19 μg/mL rolipram in stock solution) and (C) is from an animal that received rolipram (1:100 dilution of 19 μg/ml rolipram stock solution). An image of Rosenthal’s canal from the control group is shown in (D).
Notes: In each picture, an arrows point to one representative vital SGC. Magnification: 200-fold.
Abbreviation: SGC, spiral ganglion cells.
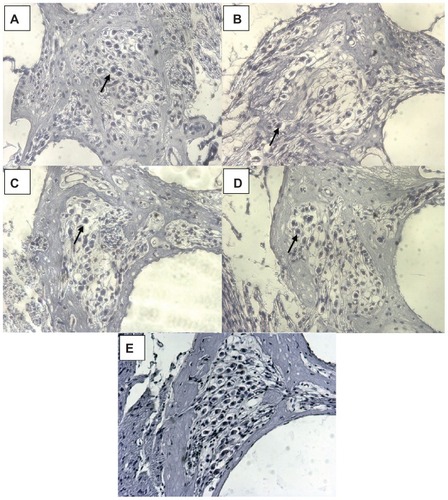
Figure S1 By frequency-specific AABR measurements on day 0, a normal hearing threshold was detected in all animals (blue and pink line; mean ± SD).
Notes: The results of the measurements on day 7 and day 21 are plotted as a red line. None of the animals had residual hearing after the deafening procedure. The hearing threshold of all animals was 90 dB SPL or above on day 7 and did not recover until the final measurement on day 21.
Abbreviations: AABR, acoustically evoked auditory brainstem response; SD, standard deviation.
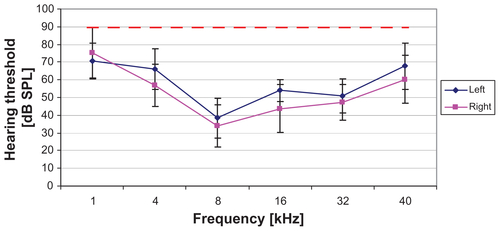
Table S1 Vitality values of dendritic cells after incubation with the test compounds and LPS stimulation; n = 3 per substance and concentration