Figures & data
Figure 1 UV-vis spectrum of purified Ag egg-white nanoparticles.
Note: Inset shows a typical optical image of the resulting product.
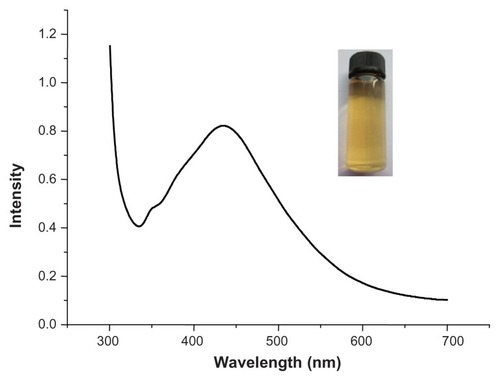
Figure 2 Fourier-transform infrared spectrum recorded from the powder of Ag nanoparticles synthesized through the use of an egg-white template.
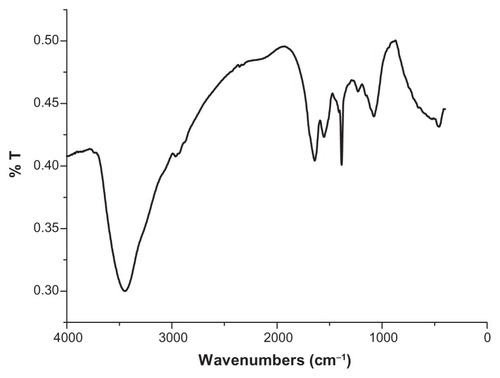
Figure 3 Transmission electron microscopy images of Ag nanoparticles at different magnifications, (A) the lower image and (B) the higher image.
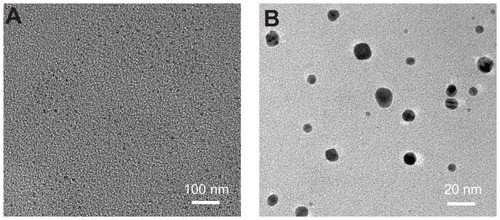
Figure 4 Size distribution of the egg white and Ag ensemble in aqueous solution according to dynamic light scattering measurements.
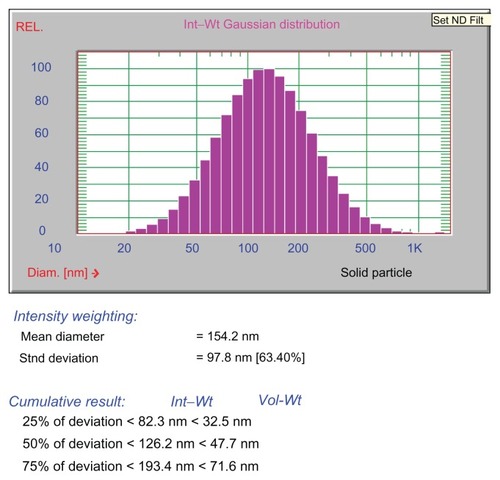
Figure 5 Cell viability of mouse fibroblast 3T3 cells after 24 hours’ incubation with increasing amounts of Ag-protein bio-conjugates showing nontoxic profiles.
Notes: Means ± standard deviation; n = 5; * P < 0.05.
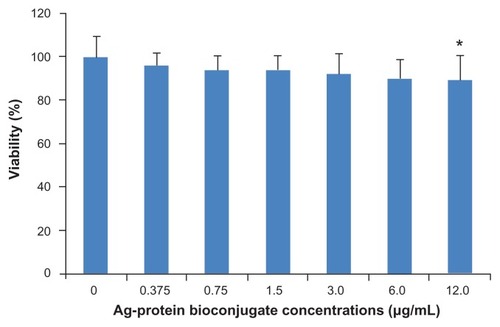
Figure 6 Optical pictures of 231 colonies. A–H are images of 4 Gy X-ray-irradiated 231 cells with the addition of Ag-protein bio-conjugate concentrations at 0, 0.375, 0.75, 1.5, 3.0, 6.0, and 12.0 μg/mL respectively. A′–H′ are images of 10 Gy X-ray-irradiated 231 cells (note that these cells were 4 Gy X-ray resistant) with the addition of Ag-protein bio-conjugate concentrations at 0, 0.375, 0.75, 1.5, 3.0, 6.0, and 12.0 μg/mL respectively.
Note: H and H′ are the crystal violet-stained results corresponding G and G′, respectively.
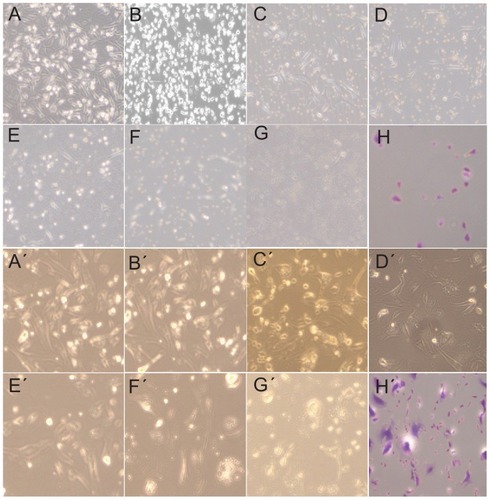
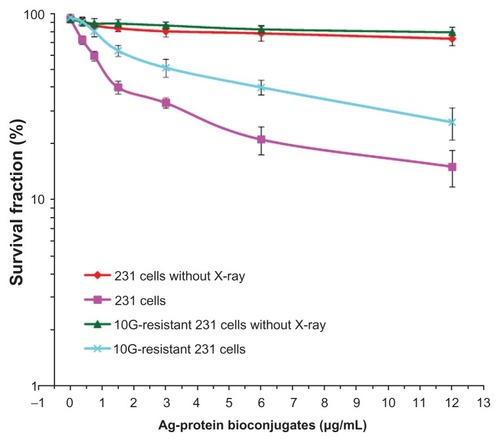
Figure 7 Survival curves of different strains of 231 cells at different Ag-protein bio-conjugate concentrations, contrasting those with/without X-ray irradiation. Clearly, the combined used of both Ag-protein bio-conjugates and X-ray did enhance the irradiation to cancer cells.
Notes: Means ± standard deviation; n = 3.