Figures & data
Figure 1 Transmission electron micrograph of calcifying nanoparticles. (A) Calcifying nanoparticles between 50 nm to 500 nm in diameter showing different electron-dense shells in calcified placental tissues. (B) Nucleic acid-like materials distributed within the individual calcifying nanoparticles in the extracellular matrix. (C) A calcifying nanoparticle self-divided into two. (D) Calcifying nanoparticles with thin shells exiting placental villus. (E) Single calcifying nanoparticles among hydroxyapatite crystals in calcified placental tissues.
Note: Bar indicates magnification of 200 nm.
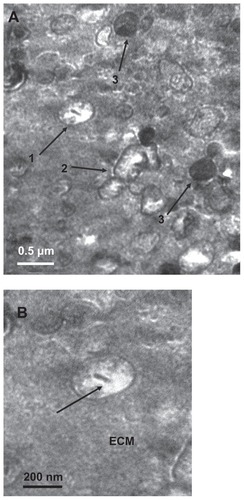
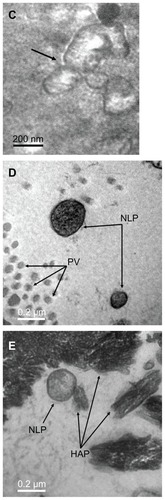
Figure 2 Growth curve of calcifying nanoparticles cultured in vitro under cell culture conditions.
Note: Mean OD650 values were recorded up to 4 weeks.
Abbreviation: OD, optical density.
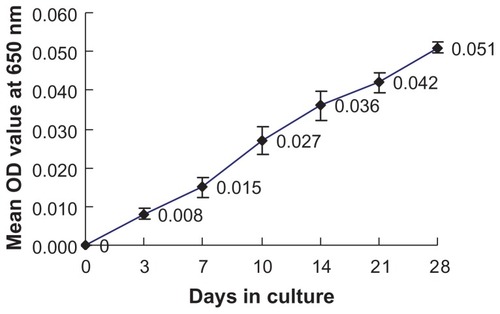
Figure 3 Transmission electron micrograph of calcifying nanoparticles cultured in vitro for four weeks. (A) Calcifying nanoparticles appear as oval-shaped particles with highly electron-dense shells. (B) Calcifying nanoparticles without shells.
Note: Bar indicates magnification of 200 nm.
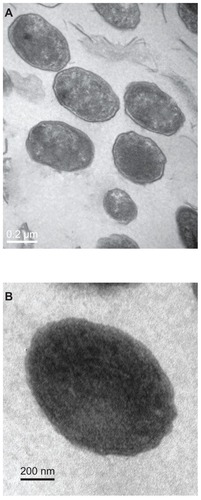
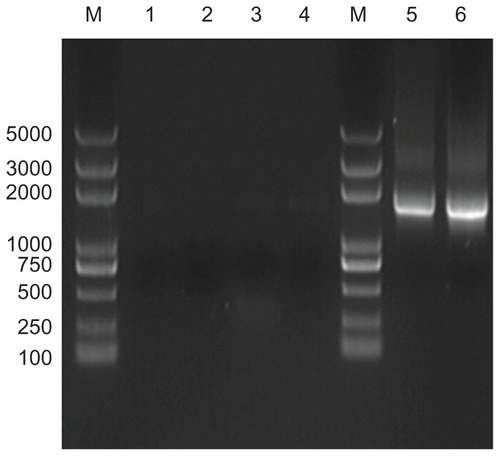
Figure 4 Analysis of target 16S rRNA gene sequences from different cultured calcifying nanoparticle samples. Lane M, DNA marker (Trans2K plus DNA marker); lane 1–6, genes from different calcifying nanoparticle samples cultured under the same conditions.
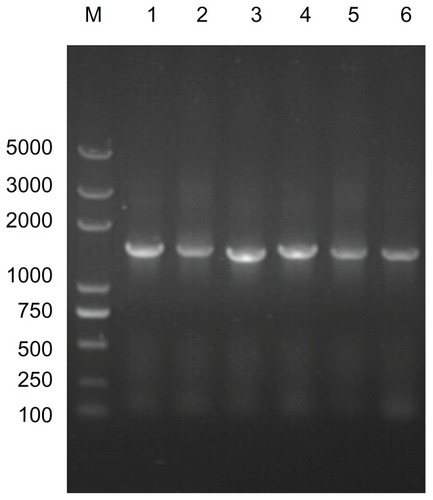
Figure 5 Analysis of target 16S rRNA gene sequences from different samples of calcified placental tissues and normal placental tissues. Lane M, DNA marker (Trans2K plus DNA marker); lane 1, negative polymerase chain reaction control without primers; lane 2, negative polymerase chain reaction control without templates; lane 3–4, genes from normal placental tissues samples; lane 5–6, genes from different calcium samples.