Figures & data
Figure 1 Morphological and physical features of c(RGDfC) polyionic complex micelles. (A) Assemblies of c(RGDfC) polyionic complex micelles in acetone/phosphate-buffered saline (1:5) are shown in a dark-field transmission electron microscopic image (bar 200 nm). The c(RGDfC) polyionic complex micelles show homogeneity in size, with an average diameter of 60.1 ± 9.2 nm. (B) Stability of c(RGDfC) polyionic complex micelles against pH variation. The variations in relative light intensity with increasing pH for c(RGDfC) polyionic complex micelles were measured by dynamic light scattering. The total concentration for each micelle system was 0.5 mg/mL at a temperature of 25°C ± 0.1°C. Relative light intensity showed no abrupt change after pH treatment. (C) Stability of c(RGDfC) polyionic complex micelles against salt. The micelles were subjected to salt treatment at a series of NaCl concentrations of 0, 0.05, 0.15, 0.3, 0.45, and 0.6 M. Relative light intensity was measured by dynamic light scattering (pH 7.4) to show dispersity. The relative light intensity showed no abrupt change after salt treatment.
Abbreviation: c(RGDfC), Cyclo(-Arg-Gly-Asp-D-Phe-Cys).
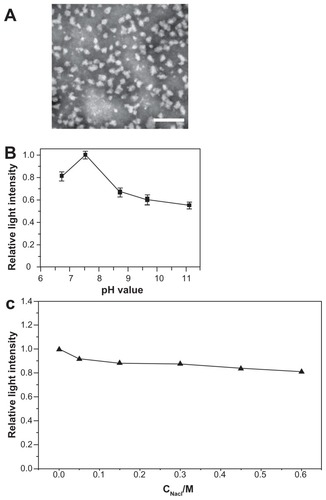
Figure 2 Biocompatibility of c(RGDfC) polyionic complex micelles with neurons. Neurons stained with Hoechst 33258 for nucleus and TUNEL for apoptosis after coculture with vehicle (A) or c(RGDfC) polyionic complex micelles (B) for 24 hours (bar 40 μm). Seven-day primary cultured neurons in each well of 6-well dishes were treated with c(RGDfC) polyionic complex micelles (150 μmol/mL) for 24 hours, stained with Hoechst 33258 and TUNEL and imaged under fluorescent microscope. (C) Cell viability of neurons following dose-dependent treatments determined by MTT assay. Seven-day primary neurons were given as 0, 50, 150, 300 and μmol/mL c(RGDfC) polyionic complex micelles, c(RGDfC), or polyionic complexes, respectively, for 4 hours. The cells were subjected to MTT assay following treatment. No significant reduction in cell viability was observed in the neurons with the c(RGDfC) polyionic complex, c(RGDfC), or polyionic complex micelles. (D) Viability of the neurons following time-dependent treatments determined by MTT assay. Neurons were cocultured with 150 μmol/mL c(RGDfC) polyionic complex, c(RGDfC), or polyionic complex micelles for a series of times, ie, 0, 2, 24, and 72 hours. The cells were subjected to MTT assay following treatment. No significant reduction of cell viability was observed in neurons treated with the c(RGDfC) polyionic complex, c(RGDfC), or polyionic complex micelles.
Note: All cellular experiments were repeated at least three times as confirmation.
Abbreviation: c(RGDfC), Cyclo(-Arg-Gly-Asp-D-Phe-Cys).
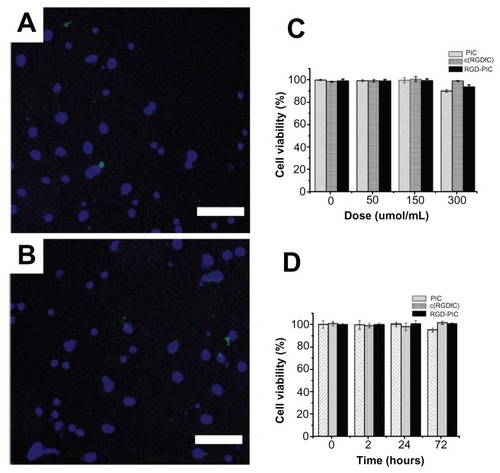
Figure 3 Inhibition of U87 glioma-derived cells after treatment with c(RGDfC) polyionic complex micelles. Apoptosis of U87 cells post treatment with c(RGDfC) polyionic complex micelles. Three-day U87 cells were treated with (A) phosphate-buffered saline, (B) 150 μmol/mL of polyionic complexes, (C) 150 μmol/mL of c(RGDfC), and (D) 150 μmol/mL of c(RGDfC) polyionic complex micelles for 4 hours and imaged under microscopy (bar 125 μm in each graph), and (E) viability of U87 cells post treatment, determined by MTT assay. To see whether the compound kills glioma cells, 3-day U87 cells cultured in 96-well plates were divided into 12 groups (n = 5), receiving 0, 50, 150, 300 μmol/mL c(RGDfC) polyionic complex micelles, c(RGDfC), or polyionic complexes for 4 hours.
Notes: The cells were subjected to MTT assay post treatment. Significant reduction of cell viability was observed in the group treated with c(RGDfC) polyionic complexes (#P < 0.05) and the group treated with c(RGDfC) (*P < 0.05), while no significant reduction of cell viability was seen in the group treated with polyionic complex micelles. All cellular experiments were repeated at least three times as confirmation.
Abbreviation: c(RGDfC), Cyclo(-Arg-Gly-Asp-D-Phe-Cys).
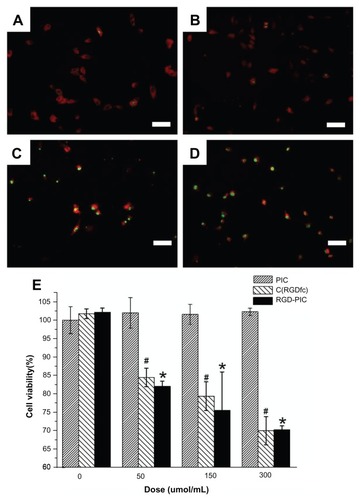
Figure 4 Quantum dot tracing of c(RGDfC) polyionic complex micelles. Quantum dot marked c(RGDfC) polyionic complex micelles in a cup. (A) Quantum dot emitting orange fluorescence. (B) The fluorescent shift from orange to reddish due to the electrostatic interaction between carboxyl groups surrounding quantum dots and active amine groups within polyionic complex spheres (actual size).
Note: This demonstrates the effective combination and encapsulation of quantum dots within a polyionic complex.
Abbreviation: c(RGDfC), Cyclo(-Arg-Gly-Asp-D-Phe-Cys).
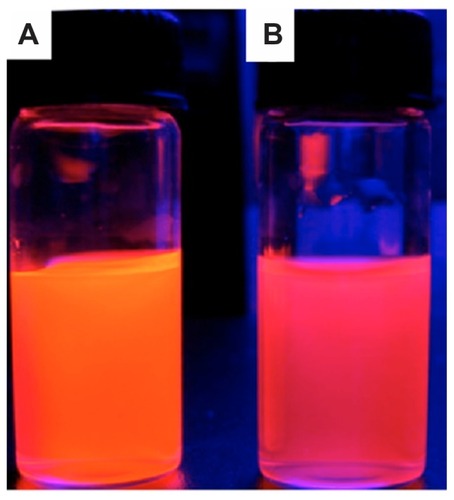
Figure 5 Increased survival time by c(RGDfC) polyionic complex micelles in rat glioma. (A) Contrast-enhanced computer tomography of glioma in rat brain;10 μL medium containing 1 × 10⁶ cells from a C6 malignant glioma cell line cells was directed into the caudate nucleus of the right brain of Wistar rats via stereotactic injection to establish an animal model of glioma. Enhanced computer tomography was conducted 3 weeks later to identify the existence of tumor in rat brain. Because a brain image on computer tomography scan was known to be symmetric, a glioma in the right hemisphere could be recognized by comparison with the left hemisphere. Enhanced computer tomography signals (black arrows) were found within the hemisphere implanted with tumor cells (right). The number “7” was a sectional sequence mark. This figure is the 7th section (bar 3 mm). (B) On day 21, c(RGDfC) polyionic complex micelles (300 μmol/mL, 1 mL/rat) were given to the rats with glioma via their tail veins, setting the phosphate-buffered saline and sham operation as control.
Note: Survival time was plotted and the statistical significance of median survival time was calculated (*P < 0.05).
Abbreviations: c(RGDfC), Cyclo(-Arg-Gly-Asp-D-Phe-Cys); PBS, phosphate-buffered saline.
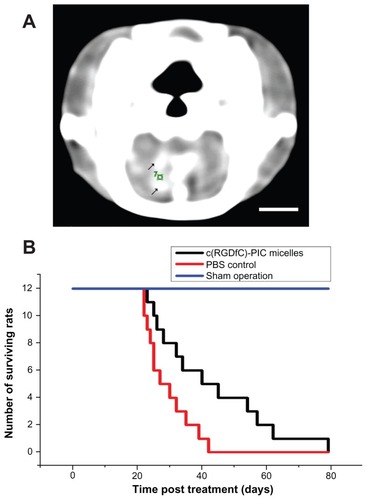
Figure 6 Quantum dot-traced target effect of c(RGDfC) polyionic complex micelles against glioma in an animal model. On day 22, QD marked c(RGDfC) polyionic complex micelles were injected into the rats via their tail veins. The rats were decapitated 24 hours later. The brains were then fixed in 4% paraformaldehyde, frozen-sectioned into 10 μm slices and subjected to standard immunohistochemical staining of caspase-3 (a specific marker for apoptotic cells) and Hoechst 33258 (a specific marker for nucleus). Typical results were shown as representative of six independent experiments. (A) Hoechst 33258 staining (blue) in the glioma area identified by computed tomography. (B) Hoechst 33258 staining (blue) in the contralateral area. (C) Quantum dot-conjugated c(RGDfC) polyionic complex micelles (red) in the glioma area. (D) Quantum dot-conjugated c(RGDfC) polyionic complex micelles (red) in the contralateral area. (E) Caspase-3-positive cells (green) in the glioma area. (F) Caspase-3-positive cells (green) in the contralateral area. (G) Merge of graph A, C, and E. (H) Merge of graph B, D, and F.
Note: Bar 25 μm.
Abbreviation: c(RGDfC), Cyclo(-Arg-Gly-Asp-D-Phe-Cys).
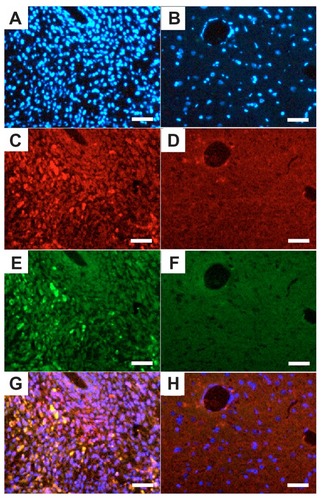
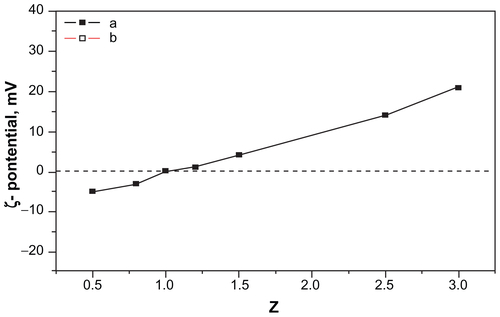
Figure S1 Zeta potential of the c(RGDfC) polyionic complex micelle solution at pH 10.
Notes: When 0 < Z < 1, the zeta potential was negative. When Z = 1, the zeta potential was around zero. When Z > 1, the zeta potential turned positive. The zeta potential increases as a result of increasing PDEA concentration. Z: Z = C1/C2. C1: concentration of PDEA, C2: concentration of PAsp.
Abbreviations: c(RGDfC), Cyclo(-Arg-Gly-Asp-D-Phe-Cys); PDEA, N-diethanolamine; PAsp, poly(aspartamide).