Figures & data
Figure 1 Equipment set-up used in this study for supercritical antisolvent system.
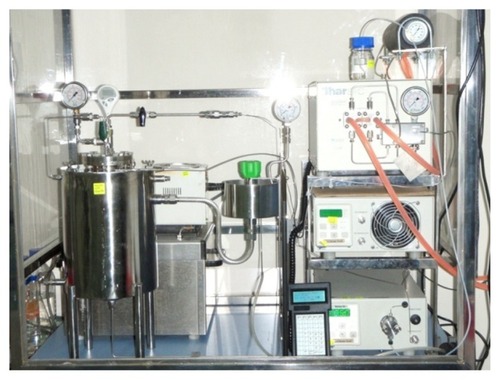
Figure 2 Scanning electron microscopy micrographs of nanoencapsulated paracetamol inside L-polylactic acid at 120 bar and different temperatures: (A) 30°C, (B) 35°C, (C) 40°C, D) 45°C, (E) 50°C, (F) 55°C.
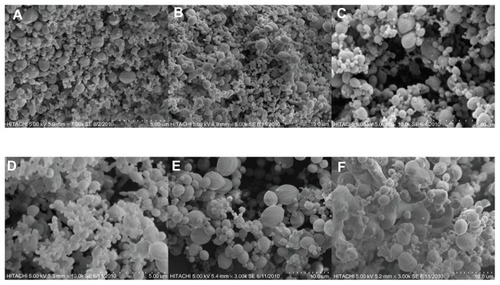
Figure 3 Effect of temperature on particle size.
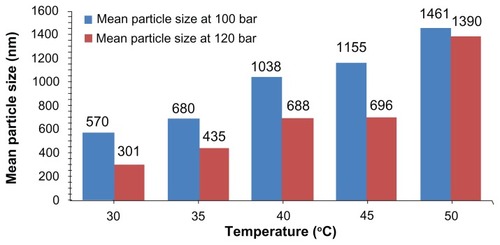
Figure 4 Scanning electron microscopy micrographs of nanoencapsulated paracetamol inside L-polylactic acid at 30ºC and different pressures: (A) 80 bar, (B) 90 bar, (C) 100 bar, (D) 110 bar (E) 120 bar.
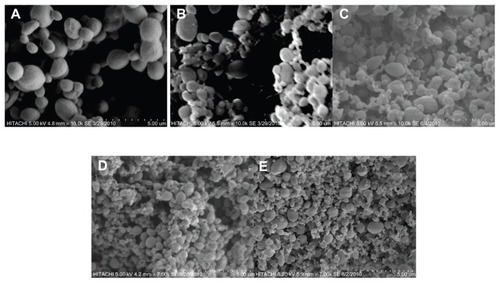
Figure 5 Effect of pressure on particle size.
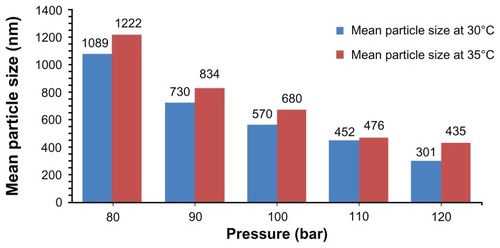
Figure 6 Internal structure of nanoparticles.
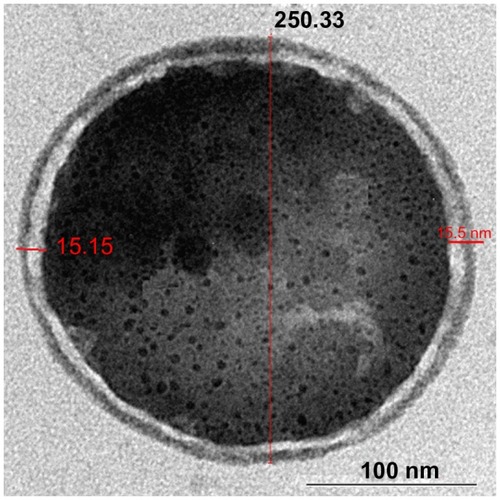
Figure 7 Energy dispersive X-ray spectroscopy of nanoparticles revealed the completed washing step.
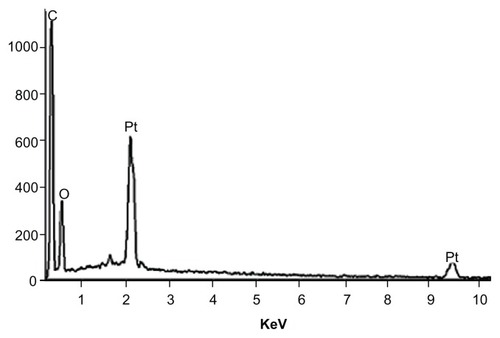
Figure 8 X-ray diffraction pattern of pure L-polylactic acid (L-PLA), pure paracetamol, and encapsulated paracetamol inside L-PLA.
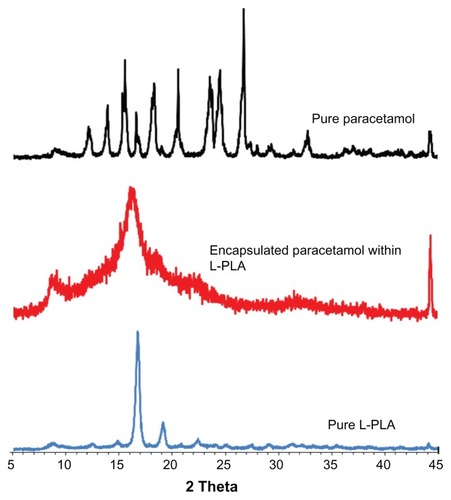
Figure 9 The comparison of melting point and crystallinity of pure L-polylactic acid and nanoparticles produced in different conditions.
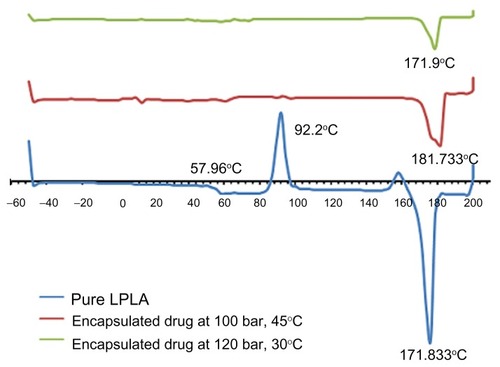
Figure 10 In vitro release profile of paracetamol encapsulated in L-polylactic acid based on the zero-order model.
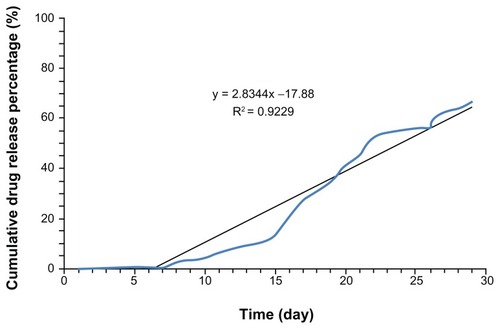
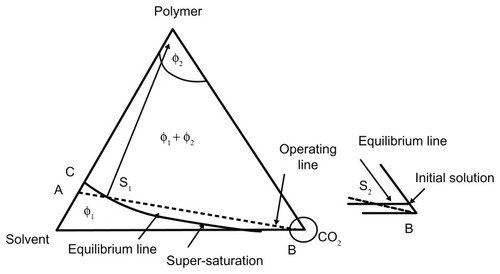
Figure 11 Ternary system for the supercritical antisolvent method.
Note: Reprinted from Yulu W, Dave RN, Pfeffer R. Polymer coating/encapsulation of nanoparticles using a supercritical anti-solvent process. J Supercrit Fluids. 2004;28:85–99, Copyright 2004, with permission from Elsevier Limited.Citation18