Figures & data
Figure 1 (A) Scanning electron microscopic and (B) transmission electron microscopic images of the morphology of mesoporous bioactive glass.
Note: Arrow represents mesoporous channels.
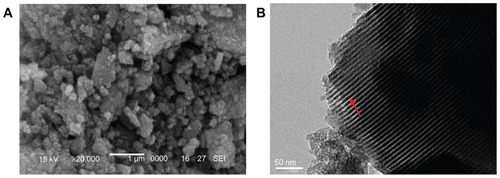
Figure 2 (A) Nitrogen gas sorption isotherms and (B) pore size distribution of mesoporous bioactive glass.
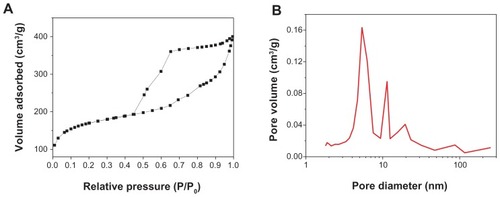
Figure 3 Photo of mesoporous bioactive glass and polyamide composite scaffolds.
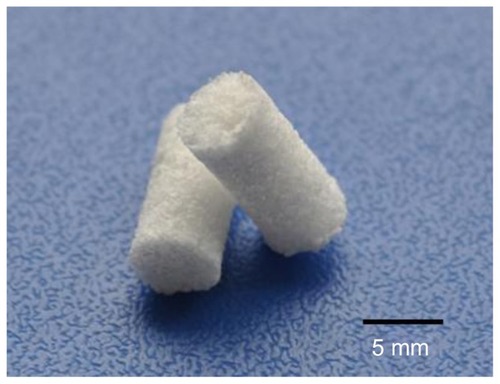
Figure 4 Scanning electron microscopic photographs of mesoporous bioactive glass and polyamide composite scaffolds at (A) ×50 and (B) ×5000 magnification.
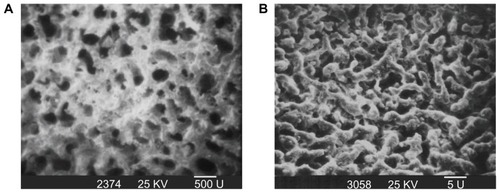
Figure 5 Attachment of MG-63 cells on mesoporous bioactive glass and polyamide composite scaffolds. Polyamide scaffolds and tissue culture plate were used as controls. Cell attachment is compared to the tissue culture plate control (100%).
Notes: *Statistical analysis: cell attachment ratio for m-BPC were significantly higher than PA and the control (P < 0.05)
Abbreviations: m-BPC, mesoporous bioactive glass and polyamide composite; PA6, polyamide 6; TCP, tissue culture plate.
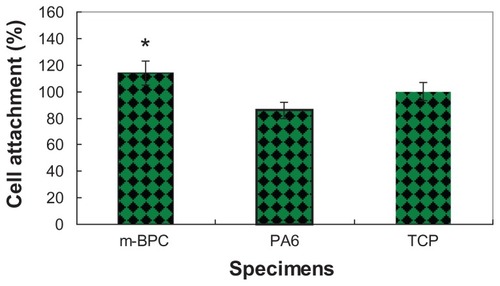
Figure 6 Phase contrast microscopic photographs of MG-63 cells cultured with (A) mesoporous bioactive glass and polyamide composite scaffolds and (B) and polyamide scaffolds for 4 hours.
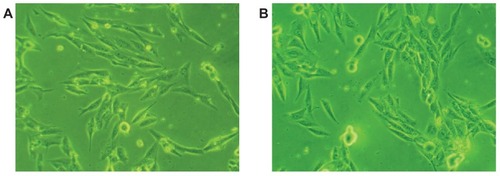
Figure 7 Macroscopic evaluation of mesoporous bioactive glass and polyamide composite scaffolds implanted into bone defects of rabbit femora for (A) 4 weeks and (B) 12 weeks.
Note: Circle and arrow show the bone defect area site.
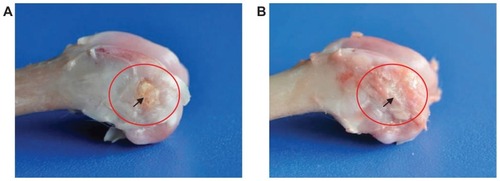
Figure 8 Synchrotron radiation-based microcomputed tomography of a three-dimensional reconstruction of cross-section images of mesoporous bioactive glass and polyamide composite scaffolds implanted into bone defects of rabbit femora for (A) 4 weeks and (B) 12 weeks.
Note: Circle and arrow show the bone defect area site.
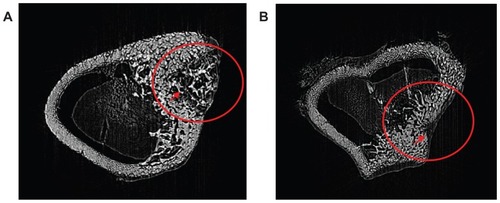
Figure 9 Hematoxylin and eosin stained section of mesoporous bioactive glass and polyamide composite scaffolds implanted into bone defects of rabbit femora for (A and B) 4 weeks (×5 and ×20, respectively) and (C and D) 12 weeks (×5 and ×20, respectively).
Notes: B represents the new bone tissue, M represents the biomaterials.
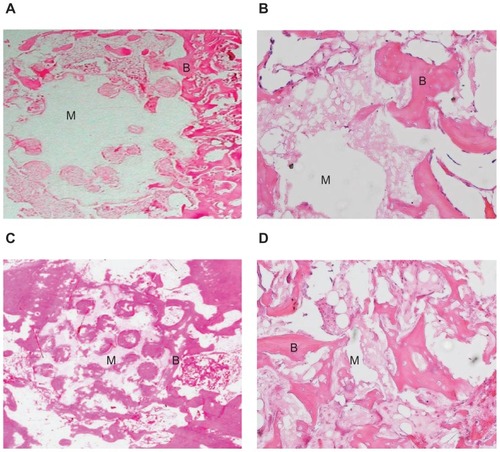
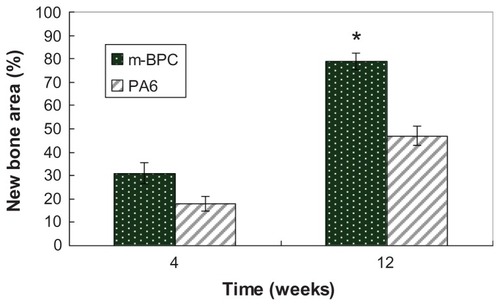
Figure 10 Quantitative analysis of the bone defect area replaced by new bone tissue after mesoporous bioactive glass and polyamide composite scaffolds, and polyamide scaffolds were implanted in vivo for 4 weeks and 12 weeks.
Notes: *Statistical analysis: new bone area ratio for m-BPC were significantly higher than PA6 (P < 0.05).
Abbreviations: m-BPC, mesoporous bioactive glass and polyamide composite; PA6, polyamide 6.