
Figures & data
Figure 1 Solubility of RVP in various surfactant solutions (1% [w/w]) (A) and CMC determination via the solubilization method (B).
![Figure 1 Solubility of RVP in various surfactant solutions (1% [w/w]) (A) and CMC determination via the solubilization method (B).](/cms/asset/2e32d209-80e7-4e6a-a8bd-fab2f7607081/dijn_a_12192289_f0001_b.jpg)
Figure 2 Dissolution profiles of micelle with or without various supersaturating agents.
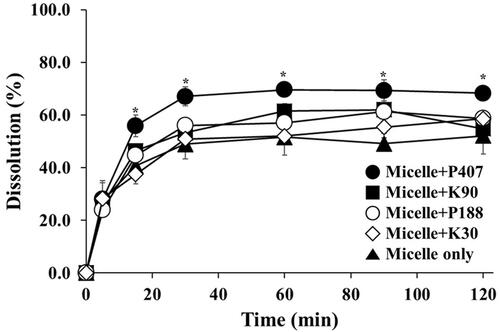
Figure 3 Plots of the CI against the ratio of solid carrier to SuM to evaluate flow property changes in SuM formulations with silica-based adsorbents (A) and cellulose-based diluents (B).
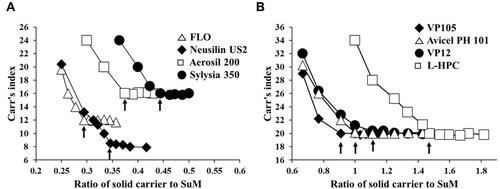
Table 1 Independent and Response Variables Used in Box-Behnken Design
Table 2 Combinations of Independent Variable and Experimental Responses from Runs
Table 3 Summary of the Results of Statistical Analysis and Model Equations for the Measured Responses
Table 4 Analysis of Variance of the Experimental Responses for Quadratic Model
Figure 4 Effects of independent factors on response variables: three-dimensional response surface plots of Y1 (A), Y2 (B), and Y3 (C).
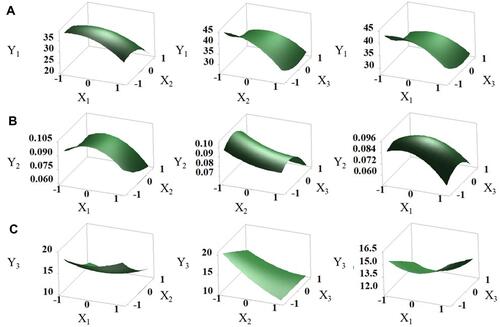
Table 5 Predicted Values and Experimental Values for the Optimized RVP-Loaded SSuM Formulation
Figure 5 Solid-state properties of powders. (A) Scanning electron microscopy images. (B) Differential scanning calorimetry thermograms. (C) Powder X-ray diffractometry patterns.
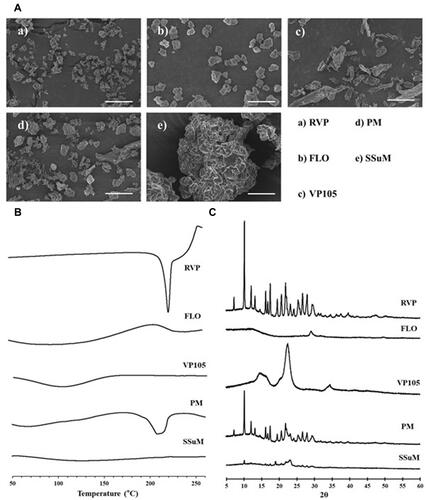
Figure 6 Dissolution profiles of raw RVP, Revaprazan® (powder), solid micelle, and the optimized SSuM in distilled water.

Figure 7 Plasma RVP concentration profiles after oral administrations of different formulations to Sprague-Dawley rats at an equivalent dose of 20 mg/kg of RVP.
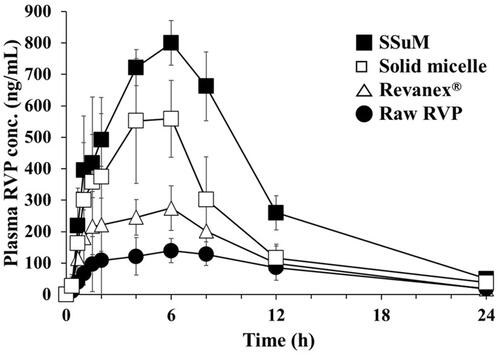
Table 6 PK Parameters of RVP Formulations in Rats