Figures & data
Table 1 Detailed experimental parameters for the synthesis of some typical samples by hydrothermal method
Figure 1 Field emission scanning electron microscopy images of hierarchically nanostructured hydroxyapatite (sample 1).
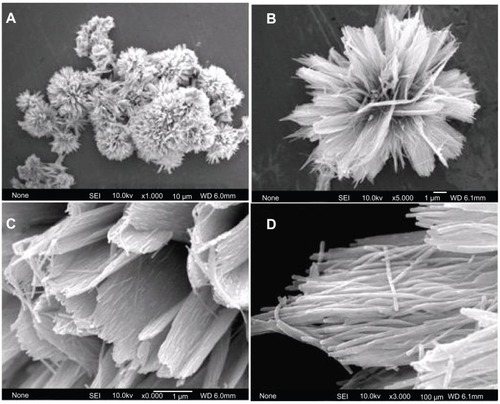
Figure 2 TEM images of hierarchically nanostructured hydroxyapatite (sample 1): (A and B) the edges of the flower-like assembly; (C) the edges of the nanosheets; (D) an individual nanorod; (E) the corresponding high-resolution TEM micrograph of (D); and (F) the nanorod after exposure to electron beam irradiation. The inset of (D) shows the corresponding selected area electron diffraction pattern.
Abbreviation: TEM, transmission electron microscopy.
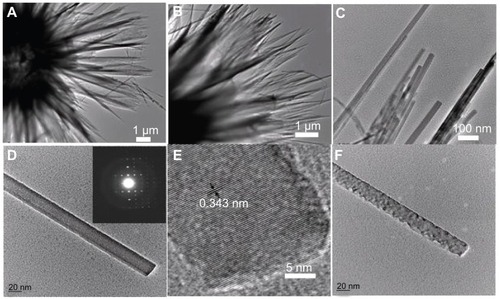
Figure 3 A typical XRD pattern (A) and FTIR spectrum (C) of hydroxyapatite powders prepared by hydrothermal method at 200°C for 24 hours; XRD pattern (B) and FTIR spectrum (D) of the sample prepared by calcination of (A) at 800°C for 3 hours.
Abbreviations: FTIR, Fourier transform infrared; XRD, X-ray powder diffraction.
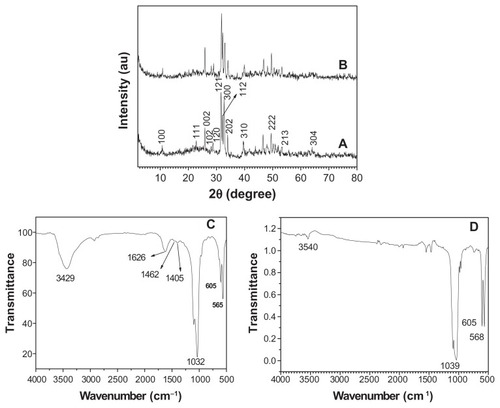
Figure 4 Energy-dispersive X-ray analysis spectrum of hierarchically nanostructured hydroxyapatite (sample 1).
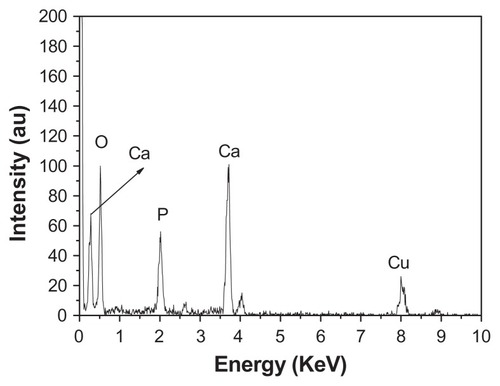
Figure 5 X-ray powder diffraction patterns of hierarchically nanostructured hydroxyapatite prepared by hydrothermal method at 200°C for different lengths of time: 3 hours (sample 3) (A); 4 hours (sample 4) (B); 6 hours (sample 5) (C); and 12 hours (sample 2) (D).
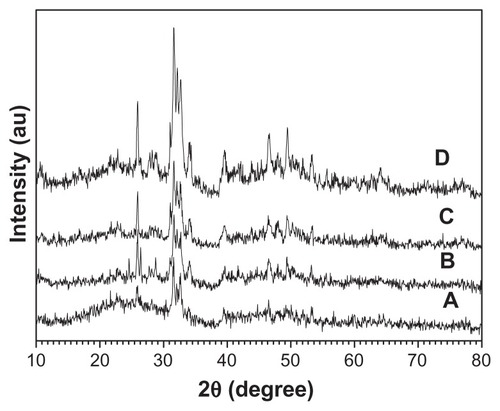
Figure 6 Scanning electron microscopy images of hierarchically nanostructured hydroxyapatite prepared by hydrothermal method at 200°C for 12 hours (sample 2).
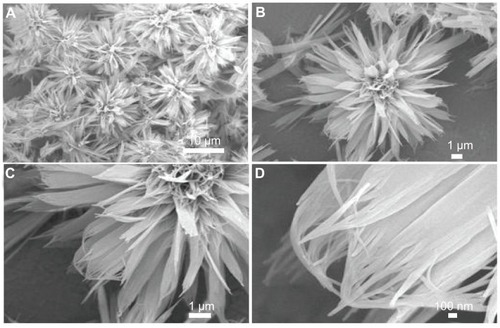
Figure 7 Scanning electron microscopy images of hierarchically nanostructured hydroxyapatite prepared by hydrothermal method at 200°C for different lengths of time: (A) 3 hours (sample 3); (B) 4 hours (sample 4); (C) 6 hours (sample 5).
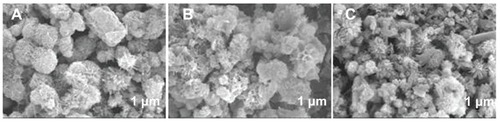
Figure 8 Scanning electron microscopy images of hierarchically nanostructured hydroxyapatite prepared by hydrothermal method at 160°C for 24 hours (sample 6).
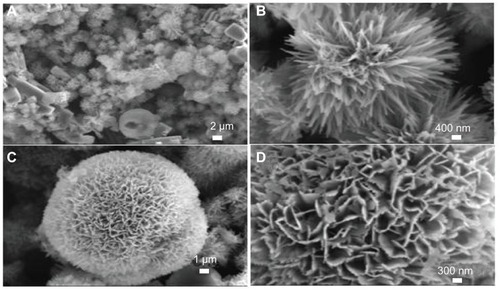
Figure 9 Schematic representation of the formation mechanism of hierarchically nanostructured HA.
Abbreviation: HA, hydroxyapatite.
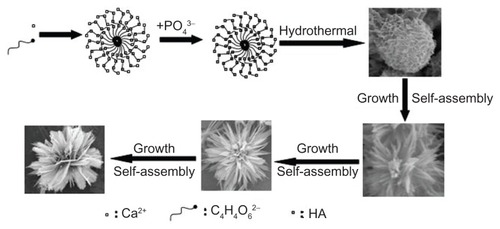
Figure 10 Scanning electron microscopy images of (A–C) the sample synthesized by using CaCl2 and NaH2PO4 without the addition of C4H4O6 KNa · 4H2O at 200°C for 24 hours (sample 7); (D–F) the sample synthesized by using CaCl2 and C4H4O6 KNa · 4H2O at room temperature for 30 minutes (sample 8); and (G–I) the sample synthesized by using CaCl2 and C4H4O6 KNa · 4H2O at 200°C for 24 hours (sample 9).
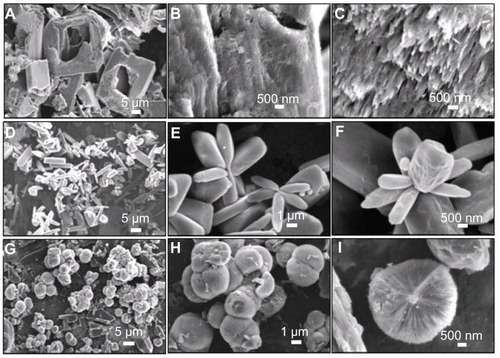
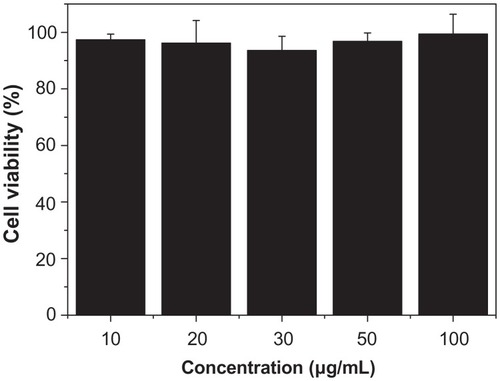
Figure 11 Viability of normal human fibroblasts incubated with hierarchically nanostructured hydroxyapatite at different concentrations.
Notes: They were determined by counting the survival cells per well in comparison with untreated cells. The error bars denote standard deviations.