Figures & data
Figure 1 Fabrication and characterization of formyl peptide receptor-targeting nanoprobes and in vitro study to assess the specificity of formyl peptide receptor-targeting nanoprobes to activated neutrophils. (A) Schematic illustration of formyl peptide receptor-targeting nanoprobes. (B) Absorbance measurements of peptides, formyl peptide receptor-targeting nanoprobes, and control nanoprobes. (C) Excitation and emission spectra of formyl peptide receptor-targeting nanoprobe. (D) Fluorescence microscopy images of activated neutrophils incubated with formyl peptide receptor-targeting nanoprobe (red color) and neutrophil-specific antibody (green color) and their superimposed image. (E) Correlation between neutrophil numbers and neutrophil-associated fluorescence intensities following incubation with either formyl peptide receptor-targeting nanoprobe or control probe.
Abbreviations: cFLFLF, cinnamoyl-Phe-(D)Leu-Phe-(D)Leu-Phe; EDC, 1-Ethyl-3-(3-(dimethylaminopropyl)carbodiimide; FPR, formyl peptide receptor; NH2, amine; PEG, polyethylene glycol; R2, correlation coefficient.
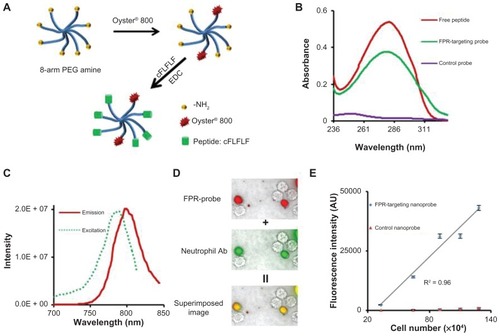
Figure 2 In the lipopolysaccharide-induced severe inflammation model, the formyl peptide receptor-targeting probe was administered intravenously 24 hours after a lipopolysaccharide subcutaneous injection. (A) The merged fluorescence and white light images (left panel) show the accumulation of the formyl peptide receptor-targeting probe at the lipopolysaccharide injection sites, but not the control site (saline injection). The mean fluorescence intensities at the lipopolysaccharide injection sites, but not saline injection sites, increased with time (right panel). (B) Ex vivo image (left) and the mean fluorescence intensity (right) of isolated tissues and organs show the overall probe biodistribution and also confirm the preferential accumulation of formyl peptide receptor-targeting probes in the inflamed tissue. (C) Representative hematoxylin and eosin staining (200×) and immunohistochemical neutrophil staining (400×) of the injection sites (left panel). Quantification of inflammatory cells (based on hematoxylin and eosin staining) and neutrophils (based on immunohistochemical staining) assured severe inflammatory responses and increased neutrophil accumulation at the lipopolysaccharide injection sites (right panel).
Abbreviations: H&E, hematoxylin and eosin; IHC, immunohistochemical; LPS, lipopolysaccharide.
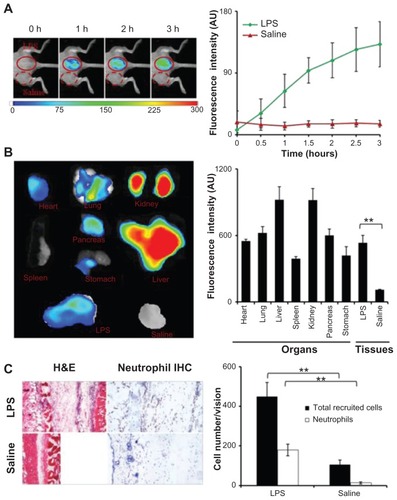
Figure 3 Poly(lactic acid) particles were implanted in neutrophil-depleted versus control mice for 24 hours prior to formyl peptide receptor-targeting nanoprobe administration. (A) Representative image of hematoxylin and eosin staining (200×) of the implant sites and quantification analysis of inflammatory cells. (B) Representative image of immunohistochemical staining (600×) and quantification analysis of neutrophils. (C) Fluorescence intensities at different time points (left panel) and in vivo image at 4 hours postinjection (right panel) illustrate the diminishing accumulation of formyl peptide receptor-targeting probes in neutrophildepleted animals in comparison with controls.
Abbreviations: H&E, hematoxylin and eosin; IHC, immunohistochemical; PLA, poly(lactic acid).
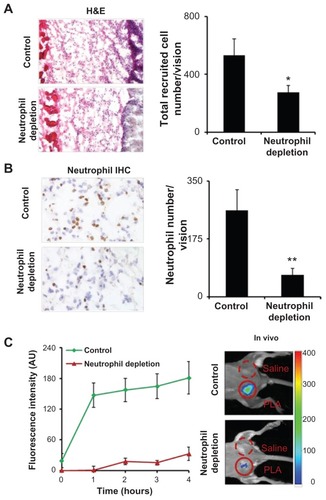
Figure 4 In a foreign body response animal model, poly(lactic acid) particles, polyethylene glycol particles, and saline were implanted subcutaneously in the back of animals for 24 hours prior to formyl peptide receptor-targeting probe injection. The animal images were taken 3 hours after probe administration. (A) Representative in vivo fluorescence imaging (left) and quantitative analysis (right) of the fluorescence intensity at different implantation sites (poly[lactic acid], polyethylene glycol, and saline). (B) Near-infrared fluorescence acquisition (red) superimposed onto the correlative phase contrast microscopy image (20×). The tissue section was unstained and unfixed to preserve the fluorescence signal. (C) Representative immunohistochemical staining of neutrophils (600×) and hematoxylin and eosin staining (400×) and (D) quantification of neutrophil numbers in tissue injected with poly(lactic acid), polyethylene glycol particles, or saline. (E) Correlation between recruited neutrophil numbers (based on histological analyses) and fluorescence intensities at the implant site.
Abbreviations: H&E, hematoxylin and eosin; IHC, immunohistochemical; PEG, polyethylene glycol; PLA, poly(lactic acid); R2, correlation coefficient.
![Figure 4 In a foreign body response animal model, poly(lactic acid) particles, polyethylene glycol particles, and saline were implanted subcutaneously in the back of animals for 24 hours prior to formyl peptide receptor-targeting probe injection. The animal images were taken 3 hours after probe administration. (A) Representative in vivo fluorescence imaging (left) and quantitative analysis (right) of the fluorescence intensity at different implantation sites (poly[lactic acid], polyethylene glycol, and saline). (B) Near-infrared fluorescence acquisition (red) superimposed onto the correlative phase contrast microscopy image (20×). The tissue section was unstained and unfixed to preserve the fluorescence signal. (C) Representative immunohistochemical staining of neutrophils (600×) and hematoxylin and eosin staining (400×) and (D) quantification of neutrophil numbers in tissue injected with poly(lactic acid), polyethylene glycol particles, or saline. (E) Correlation between recruited neutrophil numbers (based on histological analyses) and fluorescence intensities at the implant site.Abbreviations: H&E, hematoxylin and eosin; IHC, immunohistochemical; PEG, polyethylene glycol; PLA, poly(lactic acid); R2, correlation coefficient.](/cms/asset/ff1eae05-dd9a-4906-a018-6780dd224f3a/dijn_a_29961_f0004_c.jpg)
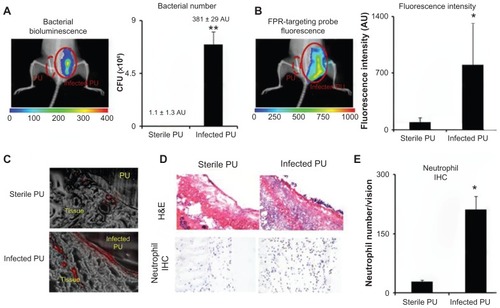
Figure 5 In an infected catheter inflammation model, polyurethane catheters were colonized with luciferase transgene Staphylococcus aureus and then transplanted subcutaneously on the back of animals for 24 hours. The animals were then administered with formyl peptide receptor-targeting nanoprobes for 3 hours prior to imaging analyses. (A) Representative bioluminescence image and the estimated bacterial colony-forming unit count depict bacterial colonization on an implanted catheter. (B) Fluorescence image and quantification of fluorescence intensity show formyl peptide receptor-targeting nanoprobe accumulation at the implantation site of infected polyurethane catheters. (C) Near-infrared fluorescence acquisition (red color) superimposed onto the correlative phase contrast microscopy image (20×) for tissues surrounding the polyurethane catheters. (D) Representative hematoxylin and eosin staining (200×) and immunohistochemical staining of neutrophils (400×) and (E) neutrophil counts support the conclusion that substantially higher numbers of neutrophils were recruited to the infected polyurethane catheters than sterile ones.
Abbreviations: H&E, hematoxylin and eosin; FPR, formyl peptide receptor; IHC, immunohistochemical; PU, polyurethane.