Figures & data
Table 1 The Composition of OFI-SNEDDSs Prepared Based on D-Optimal Mixture Design and Their Measured Globule Size
Table 2 Model Fit Statistics of OFI-SNEDDSs Globule Size
Figure 1 Diagnostic plots for globule size of OFI-SNEDDSs (A) Box-Cox for power transforms (B) externally studentized residuals vs predicted values (C) externally studentized residuals vs run number and (D) predicted vs actual globule sizes.
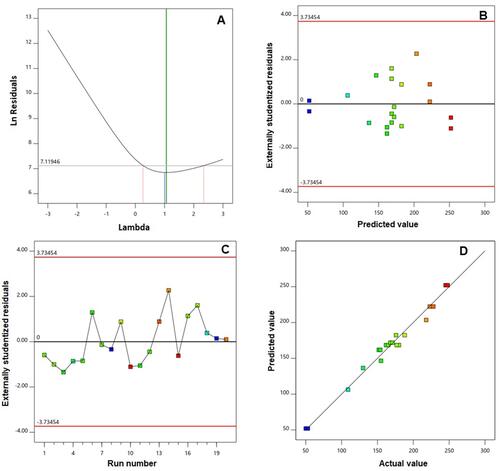
Figure 2 2D contour plot (A) and 3D response surface plot (B) for the influence of mixture components on the globule size of OFI-SNEDDSs.
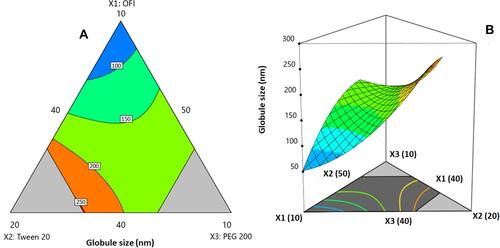
Table 3 Skin Permeation Parameters of OFI-Oil and OFI-SNEDDS Through Rat Abdominal Skin
Figure 3 Percentage of cumulative OFI permeation from OFI-SNEDDS gel and from OFI–OIL gel through abdominal rat skin.
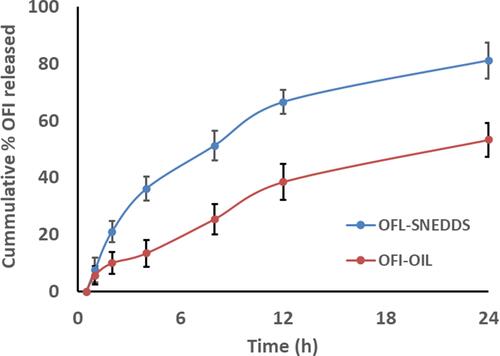
Figure 4 (A) Photographs showing wound closure in rats treated with topical application of OFI-SNEDDS on day 7 and day 14. (B) Effects of different treatments on percent wound closure. Data are presented as Mean ± SD (n = 6). Statistical analysis was performed by one-way ANOVA followed by Tukey’s test. *Significant difference from Untreated Control group at p < 0.05. #Significant difference from vehicle-treated group at p < 0.05. †Significant difference from OFI group at p < 0.05. ‡Significant difference from OFI-SNEDDS group at p < 0.05.
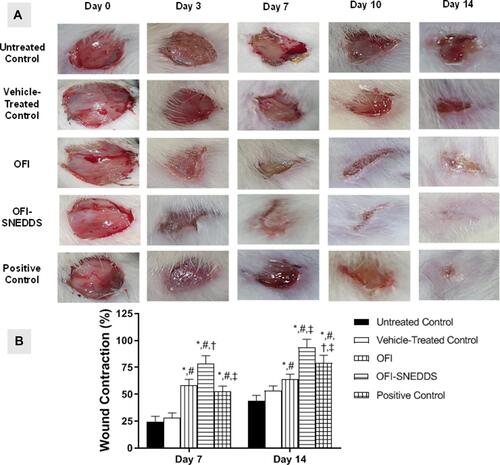
Figure 5 Histopathology effect of OFI and OFI-SNEDDS on wound healing of rats (X200). Panels A & B represent skin sections from wound areas collected at day 7 and stained with H&E and MT, respectively. Panels C & D represent skin sections from wound areas collected at day 14 and stained with H&E and MT, respectively. Arrows indicate healthy skin (black arrows), collagen deposition (red arrows), inflammatory infiltration (blue arrows), Congestion (yellow arrows).
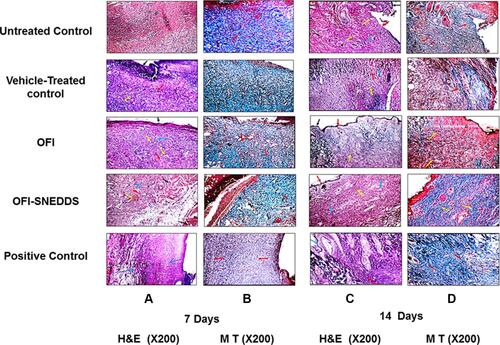
Table 4 Histological Features of Wound Healing in Animals Treated Topically with OFI-SNEDDS on Day 7
Table 5 Effect of OFI-SNEDDS on Oxidative Stress in Wounded Skin of Rats
Figure 6 Effect of OFI-SNEDDS on inflammation in wounded skin of rats. (A) represents IL-6 content and (B) represents TNF-α content. Data are presented as Mean ± SD (n = 6). Statistical analysis was performed by one-way ANOVA followed by Tukey’s test. *Significant difference from Untreated Control group at p < 0.05. #Significant difference from vehicle-treated group at p < 0.05. †Significant difference from OFI group at p < 0.05.
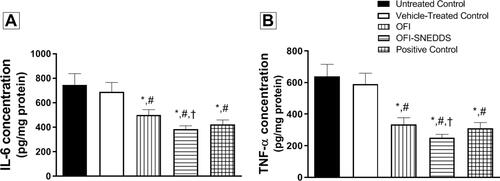
Figure 7 Effect of OFI-SNEDDS on collagen formation in wounded skin of rats. (A) represents hydroxyproline content and (B) represents Col 1 relative mRNA expression. Data are presented as Mean ± SD (n = 6). Statistical analysis was performed by one-way ANOVA followed by Tukey’s test. *Significant difference from Untreated Control group at p < 0.05. #Significant difference from vehicle-treated group at p < 0.05. †Significant difference from OFI group at p < 0.05. ‡Significant difference from OFI-SNEDDS group at p < 0.05.
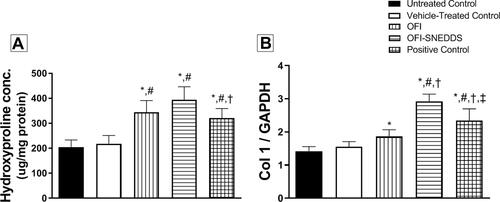
Figure 8 Effect of OFI-SNEDDS on expression of transforming growth factor-beta (TGF-β) by immunohistochemical staining. (A) Untreated Control; (B) Vehicle-treated Control; (C) OFI; (D) OFI-SNEDDS; (E) Positive Control. Negative photographs are put as inserts in their respective ones with strong positive reaction (C, D and E). (F) Quantitative image analysis for TGF-β immuno-histochemical staining, expressed as optical density (OD). Data are presented as Mean ± SD (n = 6). Statistical analysis was performed by one-way ANOVA followed by Tukey’s test. *Significant difference from Untreated Control group at p < 0.05. #Significant difference from vehicle-treated group at p < 0.05. †Significant difference from OFI group at p < 0.05.
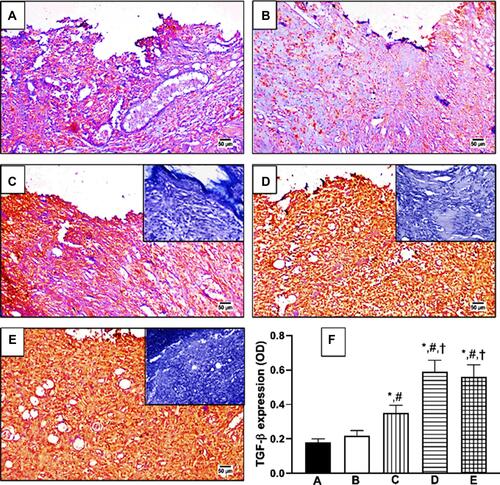
Figure 9 Effect of OFI-SNEDDS on expression of vascular endothelial growth factor (VEGF) by immunohistochemical staining. (A) Untreated Control; (B) Vehicle-treated Control; (C) OFI; (D) OFI-SNEDDS; (E) Positive Control. Negative photographs are put as inserts in their respective ones with strong positive reaction (C, D and E). (F) Quantitative image analysis for TGF-β immuno-histochemical staining, expressed as optical density (OD). Data are presented as Mean ± SD (n = 6). Statistical analysis performed by one-way ANOVA followed by Tukey’s test. *Significant difference from Untreated Control group at p < 0.05. #Significant difference from vehicle-treated group at p < 0.05. †Significant difference from OFI group at p < 0.05.
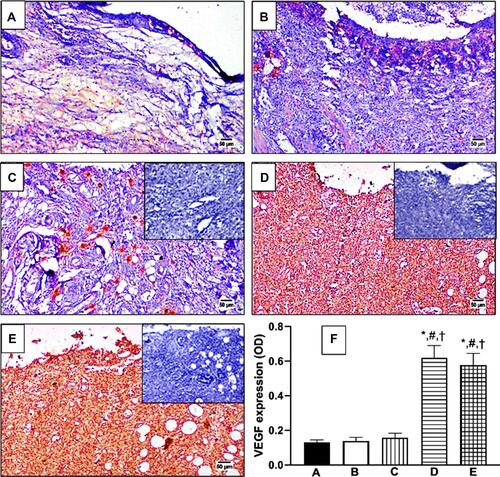
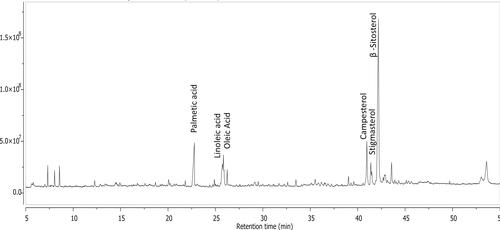
Figure 10 Total ion chromatogram of GC/MS analysis of hexane fraction of OFI seeds.