Figures & data
Figure 1 Microvessel scaffold design.
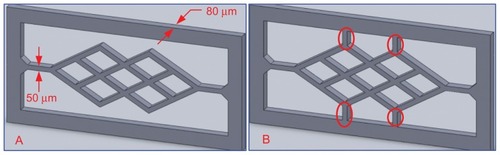
Figure 2 Scanning electron microscopic images of polylactic-co-glycolic acid line patterns fabricated under a constant scanning speed of 0.05 mm/sec and a laser power of 0.45–60 mW.
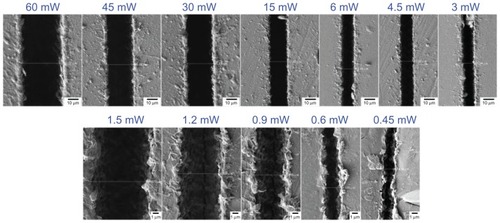
Figure 3 Ablation line width and depth as a function of laser power at scanning speeds of 0.05 mm/sec and 0.5 mm/sec.
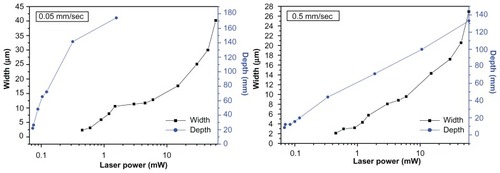
Figure 4 Fabrication strategy for the polylactic-co-glycolic acid scaffold and a scaffold fabricated under laser ablation. (A) Fabrication strategy and (B) fabricated scaffold.
Abbreviations: PLGA, polylactic-co-glycolic acid.
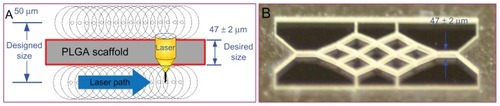
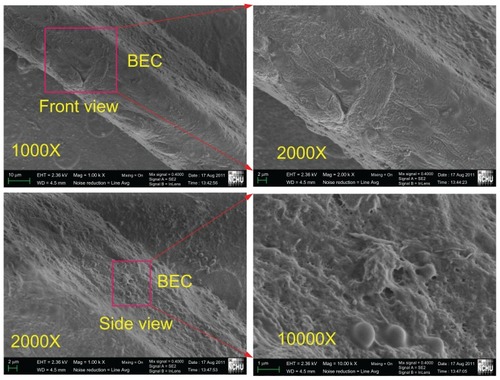
Figure 5 Scanning electron microscopic images of the laser-fabricated scaffold.
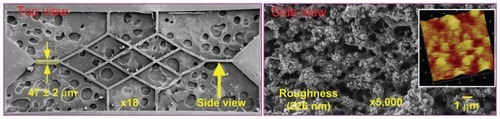
Figure 6 Electric force microscopy images for zeta potential analysis. (A) Electric force microscopy image, (B) phase image, and (C) phase image when the focal length was increased by 3 μm.
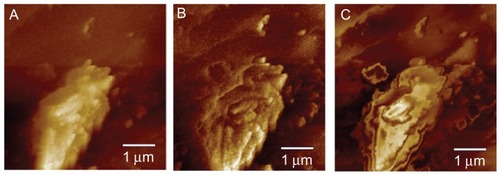
Figure 7 Optical microscopy images of bovine endothelial cell adhesion on the polylactic-co-glycolic acid scaffold. (A) One day’s seeding, (B) three days’ seeding, (C) five days’ seeding, and (D) seven days’ seeding.
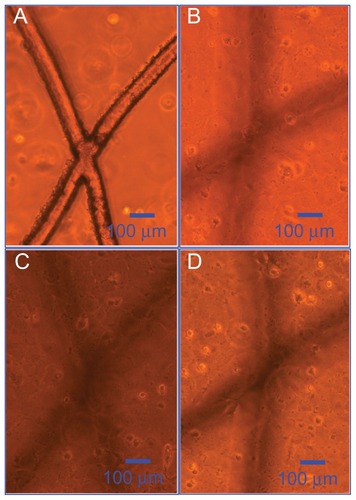
Figure 8 Fluorescent images of cultured cells on the scaffold. (A) DAPI-labeled nuclei and (B) labeled skeletons and nucleus.
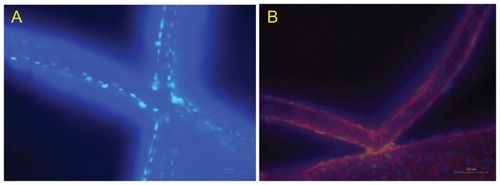
Figure 9 Scaffolds for cell cover ratio estimation.
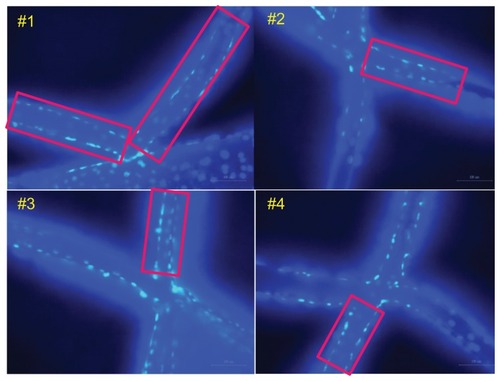
Table 1 Cell cover ratio on the scaffold
Figure 10 Scanning electron microscopic images of bovine endothelial cells cultured on a branch of a pillared microvessel network for 14 days.