Figures & data
Table 1 Uptake of Lac-NCTD on Caco-2 cells with different preparations (n = 3)
Table 2 Papp of Lac-NCTD at different concentrations in Caco-2 cells (n = 3)
Table 3 Papp of Lac-NCTD on Caco-2 cells with different preparations (n = 3)
Figure 1 Particle size distribution analysis using a Zetasizer Nano particle analyzer.
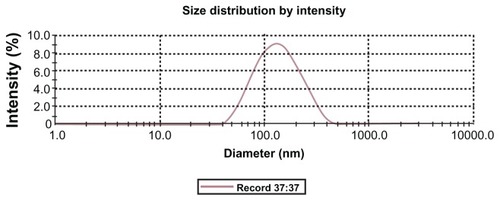
Figure 2 TEM micrograph of Lac-NCTD-TMC-NPs.
Abbreviations: TEM, transmission electron microscopy; Lac-NCTD-TMC-NPs, lactosyl-norcantharitin (Lac-NCTD)-associated N-Trimethyl chitosan nanoparticles.
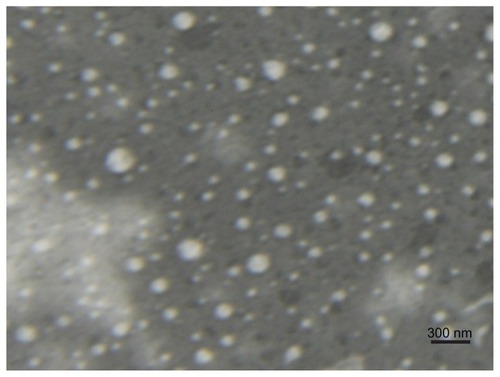
Figure 3 Time course of Lac-NCTD uptake in Caco-2 cell monolayers.
Note: Error bars represent standard error of the mean value for three determinations.
Abbreviations: Lac-NCTD, lactosyl-norcantharitin; Caco-2, continuous line of heterogeneous human epithelial colorectal adenocarcinoma cells.
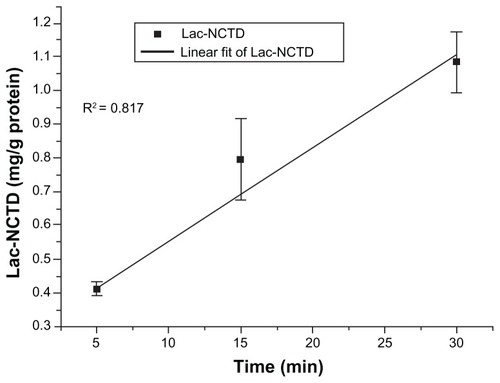
Figure 4 Effect of Lac-NCTD concentration on Caco-2 cells uptake.
Note: Error bars represent standard error of the mean value for three determinations.
Abbreviations: Lac-NCTD, lactosyl-norcantharitin; Caco-2, continuous line of heterogeneous human epithelial colorectal adenocarcinoma cells.
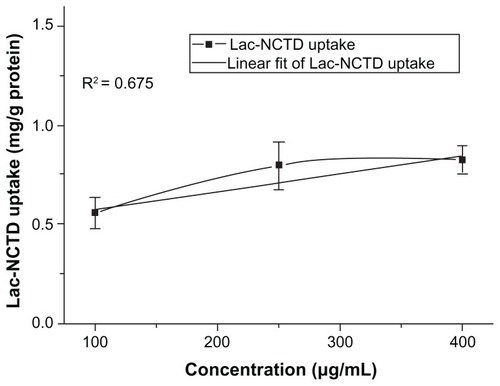
Figure 5 Effect of CyA and MK-571 on Caco-2 cells uptake.
Notes: **P < 0.01 versus control group; ##P < 0.01 versus control group. Error bars represent standard error of the mean value for three determinations.
Abbreviations: CyA, cyclosporine; MK-571, Sigma-MK-571 sodium salt hydrate; Caco-2, continuous line of heterogeneous human epithelial colorectal adenocarcinoma cells.
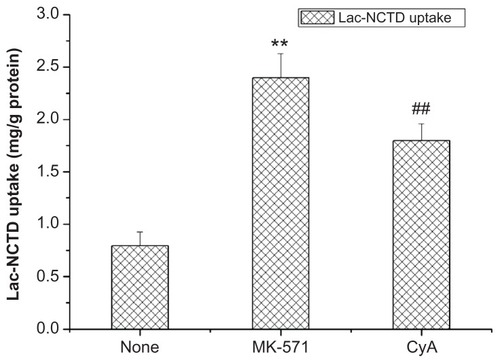
Figure 6 Effect of CyA, MK-571 on the transport of Lac-NCTD.
Notes: *P < 0.05 versus control group; **P < 0.01 versus control group; ##P < 0.01 versus control group. Error bars represent standard error of the mean value for three determinations.
Abbreviations: CyA, cyclosporine; MK-571, Sigma-MK-571 sodium salt hydrate; Lac-NCTD, lactosyl-norcantharitin.
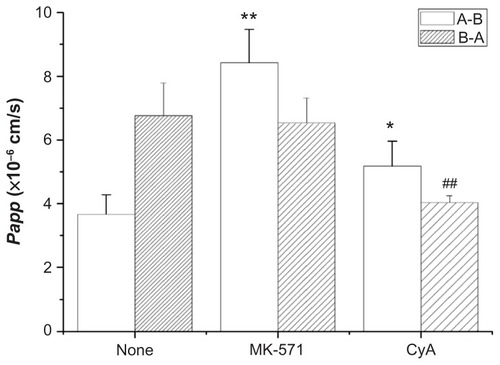
Figure 7 Effect of oxophenylarsine and SDCh on the transport of Lac-NCTD.
Notes: #P < 0.05 versus control group. Error bars represent standard error of the mean value for three determinations.
Abbreviations: SDCh, sodium deoxycholate; Lac-NCTD, lactosyl-norcantharitin.
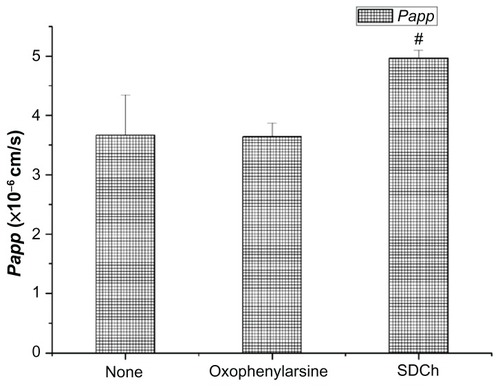
Figure 8 Laser scanning confocal microscopy images showing uptake and subcellular localization of FITC-labeled Lac-NCTD-CS-NPs and FITC-labeled Lac-NCTD-TMC-NPs. Panel 1. Green fluorescence shows the location of FITC-labeled Lac-NCTD-CS- NPs or FITC-labeled Lac-NCTD-TMC-NPs. Panel 2. Blue fluorescence shows nuclear staining with Hoechst33258. Panel 3. Overlaid image of Panel 1 and Panel 2. (A, C, E): Lac-NCTD-CS-NPs groups. (B, D, F): Lac-NCTD-TMC-NPs groups. (A and B): 15 min. (C and D): 30 min. (E and F): 60 min.
Abbreviations: FITC-labeled, fluorescein isothiocyanate-labeled; Lac-NCTD-CS-NPs, lactosyl-norcantharitin (Lac-NCTD)-associated N-Trimethyl chitosan nanoparticles; Lac-NCTD-TMC-NPs, lactosyl-norcantharitin (Lac-NCTD)-associated N-Trimethyl chitosan nanoparticles.
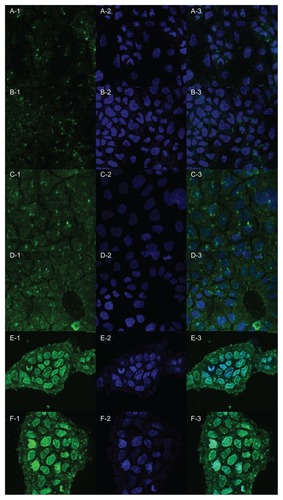
Figure 9 Atomic force microscope micrograph of Caco-2 cells. A: Caco-2; B: Caco-2 after treatment with Lac-NCTD-TMC-NPs. (10 μm × 10 μm).
Abbreviations: Caco-2, continuous line of heterogeneous human epithelial colorectal adenocarcinoma cells; Lac-NCTD-TMC-NPs, lactosyl-norcantharitin (Lac-NCTD)- associated N-Trimethyl chitosan nanoparticles.
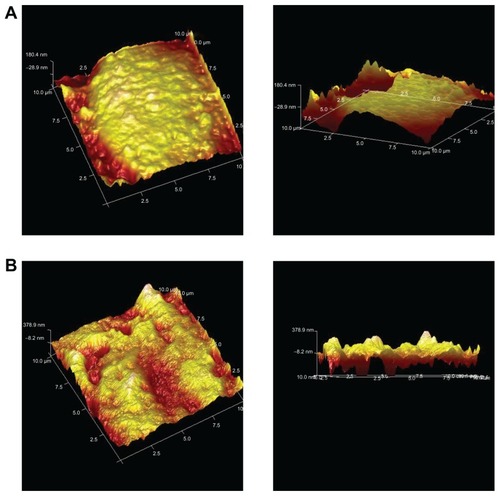
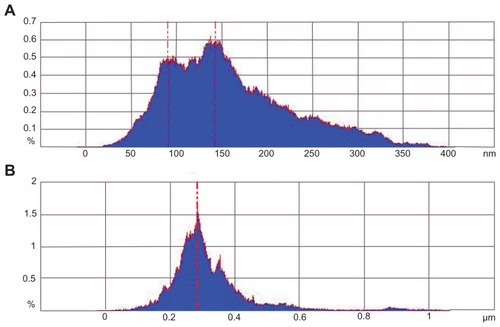
Figure 10 Size distribution histogram of protrusions on Caco-2. A: Caco-2; B: Caco-2 after treatment with Lac-NCTD-TMC-NPs.
Abbreviations: Caco-2, continuous line of heterogeneous human epithelial colorectal adenocarcinoma cells; Lac-NCTD-TMC-NPs, lactosyl-norcantharitin (Lac-NCTD)-associated N-Trimethyl chitosan nanoparticles.