Figures & data
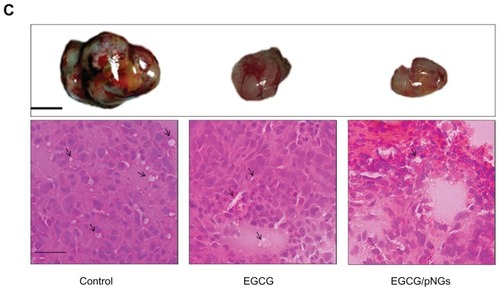
Figure 1 Transmission electron microscopy analysis of pNG particles.
Note: Right-inset photograph shows the light-purple color of pNG dispersion, and the left inset shows the dominant peak between 1.6 nm in the particle-size distribution graph generated by photon correlation spectroscopy.
Abbreviation: pNG, physical nanogold.
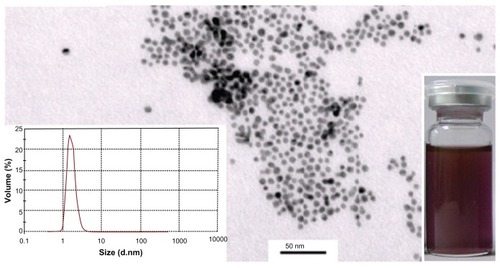
Figure 2 The characteristics of EGCG-pNG particles show the percentage of EGCG capped on pNGs (○), particle size (⋄), and zeta potential (□) at different ratios of EGCG:pNG (23:0, 23:1, 23:1.25, 23:2.5, 23:5, and 0:5).
Abbreviations: EGCG, epigallocatechin-3-gallate; pNG, physical nanogold.
Figure 3 (A) The influence of pH on EGCG-pNG dissociation over time; (B) the relationship with the dissociation rate constant of EGCG-pNG; (C) the release amount of EGCG from the release profile of EGCG-pNG particles in HCl solution (pH 1.2) at 36°C.
Notes: ■, free EGCG; ▴, EGCG-pNG.
Abbreviations: EGCG, epigallocatechin-3-gallate; HCl, hydrochloride; pNG, physical nanogold.
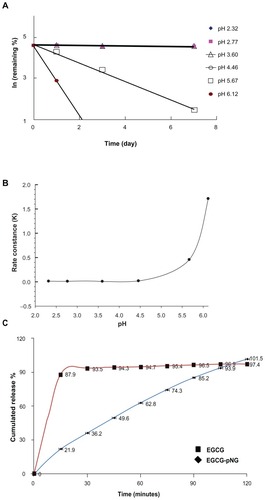
Figure 4 Antioxidant effects of EGCG (□), pNG (![]()
Note: **P < 0.01.
Abbreviations: EGCG, epigallocatechin-3-gallate; pNG, physical nanogold.
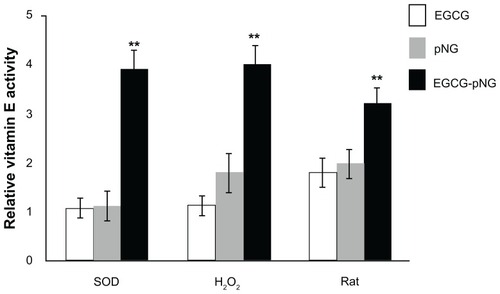
Figure 5 Cell viability of MBT-2 cells treated with EGCG and/or pNG at different concentrations over 24 and 48 hours.
Notes: *P < 0.5, **P < 0.01.
Abbreviations: EGCG, epigallocatechin-3-gallate; pNG, physical nanogold.
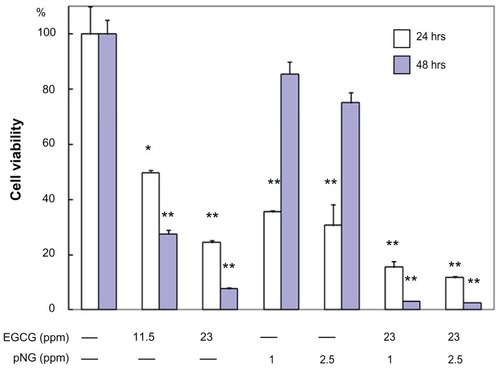
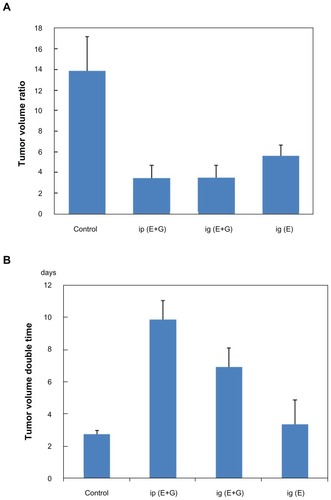
Figure 6 Growth inhibition effects of EGCG and in combination with pNG in a murine MBT-2 subcutaneous tumor model: (A) tumor-volume ratio in the mice was detected individually following treatment by feeding 2 mg/mouse EGCG or 2 mg/mouse EGCG-pNG (23:2.5) via an oral route (ig) and intaperitonially (ip); (B) tumor-volume double time indicating tumor volumes in mice receiving the different drugs (control, EGCG, and EGCG-pNG) at day 29; (C) photographs and histology (H&E staining, 40×) of excised tumors from mice. Pictures of tumors show engorgement of tumor vessels in the control group that are larger than the EGCG and EGCG-pNG groups. The H&E-staining histology of the tumor mass shows more vessels in the cross-sectional view in the control compared to the other groups.
Notes: Black line, 1 cm; black arrows, tumor vessels; scale bar, 25 μm.
Abbreviations: EGCG, epigallocatechin-3-gallate; H&E, hematoxylin and eosin; pNG, physical nanogold.