Figures & data
Figure 1 NBTXR3 nanoparticles are endocytosed by cancer cells and form clusters in the cytoplasm. Transmission electronic microscopy (TEM) representative images of NBTXR3 nanoparticles uptake, forming clusters in CAL-33, FaDu, NCI-H460-Luc2, MDA-MB-231-luc-D3-H2LN (upper panel) and DU-145, LNCaP, PC-3, Detroit 562 cells (lower panel). Cells were treated overnight with NBTXR3. 100µM, 400µM and 800µM indicate concentrations of NBTXR3 added to cells; arrows indicate NBTXR3 clusters.
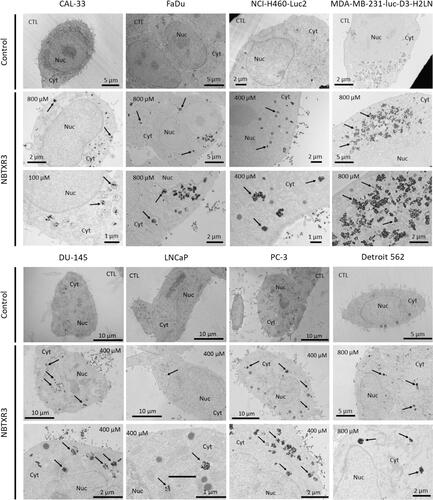
Table 1 Compilation of Preclinical Studies Performed with NBTXR3
Figure 2 NBTXR3 activated by RT kills more cancer cells than RT alone. (A) Clonogenic assay in DU-145, PC-3, HEP-3B (upper panel), T98G, and MIA PaCa-2 (lower panel). Cells were treated overnight with various concentrations of NBTXR3, then irradiated. After several days, colonies were stained using crystal violet and counted. Presented data were obtained from at least three independent experiments (n≥3). Data are represented as surviving fraction percentage (SF (%)) ± SEM. (B) Surviving fraction (SF) and corresponding Dose Enhancement Factor (DEF) for each condition. Percentage of surviving fraction (SF) ± SD and dose enhancement factor (DEF) ± SD. n ≥ 3. *p<0.05; **p<0.01; ***p<0.001.
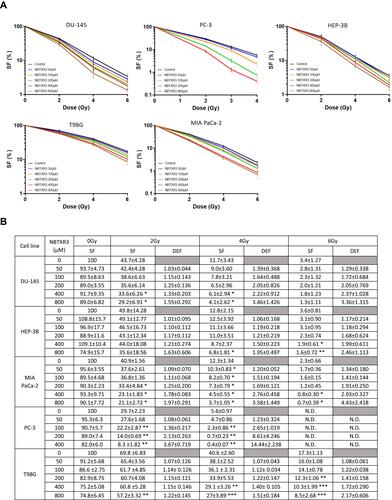
Figure 3 After intratumoral injection, NBTXR3 distributes and remains in the tumor. (A) Thanks to its composition, NBTXR3 is easily observable in the tumor by µCT (white areas indicated by the arrows). (B) 3D representation of the of NBTXR3 nanoparticles distribution within tumor tissues of models NCI-H460-Luc2, PC-3 and LPS80T3 (upper panel), DU-145, FaDu (middle panel), CAL-33 and PAC-120 (lower panel), after µCT analysis. Indicated day corresponds to time post-intratumoral injection (D01).
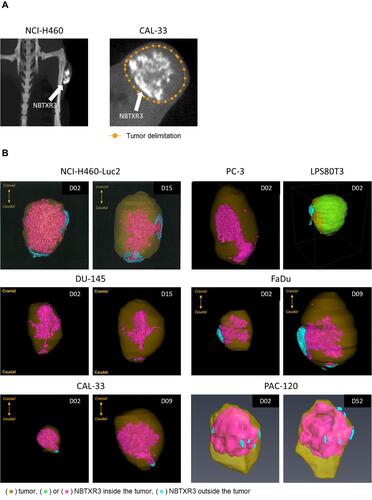
Figure 4 NBTXR3 activated by radiotherapy controls tumor growth more effectively than radiotherapy alone. (A) The ability of NBTXR3 to control tumor growth better than radiotherapy as well as the impact on survival was tested in nude mice bearing a tumor of CAL-33, FaDu, LPS80T3, HT1080 (left column), DU-145, PC-3 and NCI-H460-Luc2 (right column). Number of mice per group: 5–6. Tumor growth curves are expressed as mean relative tumor volume (RTV) ± SEM. (B) Table indicative of the types of cancers tested, the doses of RT used and the source of radiotherapy. (C) Tumor doubling time, optimal T/C and median survival of the in vivo experiment results.
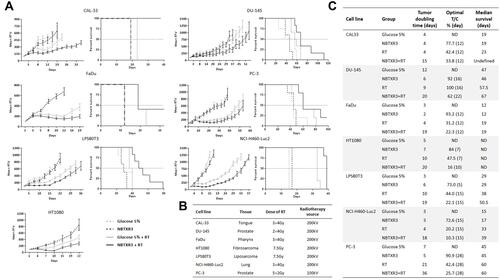
Figure 5 RT-activated NBTXR3 improves the efficacy of cisplatin. The capacity of NBTXR3 to kill cancer cells, in combination or not with cisplatin (725nM of CDDP for 6 hours or 405nM of CDDP for 16 hours), was analyzed by clonogenic assay on the NCI-H460-Luc2 cell line, after an incubation of 6h (A) or 16h (B) with cisplatin before irradiation. Presented data were obtained from five independent experiments (n=5). Data are represented as surviving fraction percentage (SF (%)) ± SEM. Surviving fraction (SF) and corresponding Dose Enhancement Factor (DEF) for each condition are indicated and time point are indicated on the lower panel. *p<0.05 vs CTL. (C) The ability of NBTXR3 to control tumor growth was compared in combination or not with cisplatin (CDDP, 1mg.kg−1). Tumor growth curves are expressed as mean tumor volume (TV) ± SEM. Number of mice per group: 5.
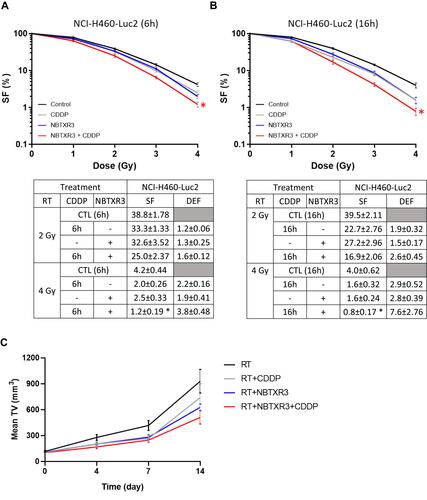
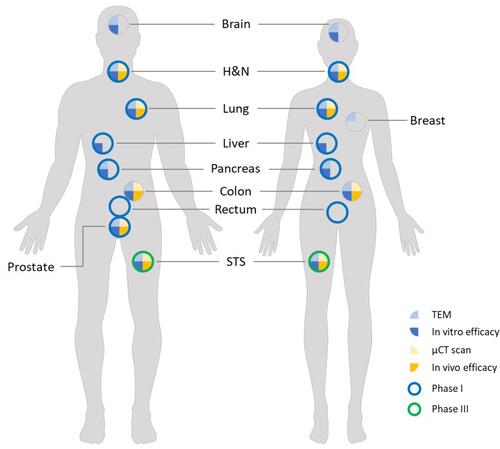
Figure 6 Review of studies with NBTXR3. The various experiments carried out in vitro and in vivo on the various human models demonstrated the effectiveness of NBTXR3 and its capacity to treat any kind of solid tumor. These preclinical results have been confirmed in a Phase II/III clinical trial in patients with soft tissue sarcoma, and other Phase I trials are currently in progress.