Figures & data
Figure 1 Preparation and characterization of PLGA-ICG-R848 NPs. (A) The mean diameter of PLGA-ICG-R848 NPs was determined by DLS device. (B) SEM analysis was applied to identify the nanoparticle size and shape characterization. Scale bar = 100nm. (C) Under IVIS-200 Imaging System, ICG fluorescence could be detected in groups of free ICG, PLGA-ICG and PLGA-ICG-R848, but was not observed in PLGA, PLGA-R848 and PBS. (D) The characteristic absorption peaks of ICG and R848 were identified by DS-11 microvolume spectrophotometer, demonstrating the successful encapsulation of ICG and R848 in the PLGA core.
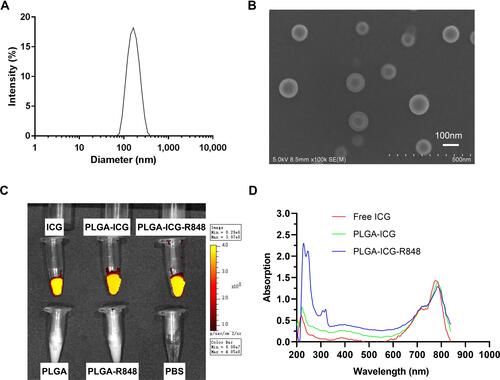
Figure 2 PLGA-ICG-R848 NPs plus laser irradiation inhibited PCa cell viability. (A) ICG fluorescence was observed in RM9 cells after 2 h treatment, and stronger fluorescence was observed with the longer incubation time in groups of PLGA-ICG and PLGA-ICG-R848. (B) Mean fluorescence intensity (MFI) of ICG fluorescence was quantified in groups of PLGA-ICG and PLGA-ICG-R848. (***P < 0.001, n = 10). (C) After RM9 cells were treated with PLGA-ICG-R848 containing different ICG concentrations, the cell viability exhibited no significant difference in the group of PLGA-ICG-R848 without laser irradiation. But the viability rate significantly decreased in a dose-dependent manner in the group of PLGA-ICG-R848+laser. (*P < 0.05, n = 6). (D) After 4 h treatment, prostate cancer cells of RM9, PC-3, LNCaP and DU-145 were irradiated without or with 808 nm laser. The cell viability of PLGA-ICG+laser and PLGA-ICG-R848+laser was significantly inhibited, but there was no significant inhibition in groups of PBS, PBS+laser, PLGA+laser and PLGA-R848+laser (*P < 0.05, n = 5).
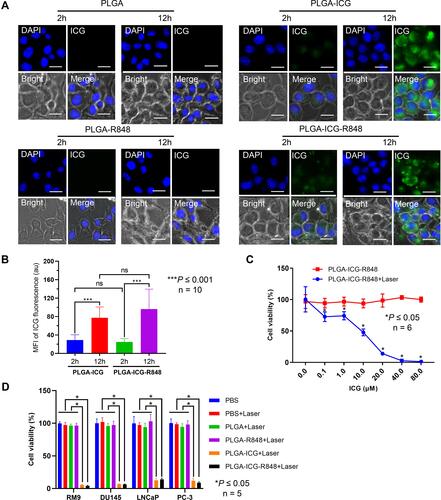
Figure 3 PLGA-ICG-R848 increases the maturation markers of BMDCs. (A and B) On day 8, the BMDCs were collected and then treated with (1) PBS, (2) PLGA, (3) PLGA-ICG, (4) PLGA-R848, (5) PLGA-ICG-R848, (6) R848 (5 μg/mL) and (7) LPS (0.1 μg/mL). After 48h treatment, flow cytometry was performed to analyze the percentage of CD11c+CD86+ cells and CD11c+CD80+ cells. (C) The percentage of CD11c+CD86+ cells in any group of PLGA-R848, PLGA-ICG-R848 and R848 (5μg/mL) was significantly higher than that in any group of Control, PLGA and PLGA-ICG, and it was the same as CD11c+CD80+ cells (*P < 0.05, n = 3). Data are expressed as the mean ± SD from three independent experiments.
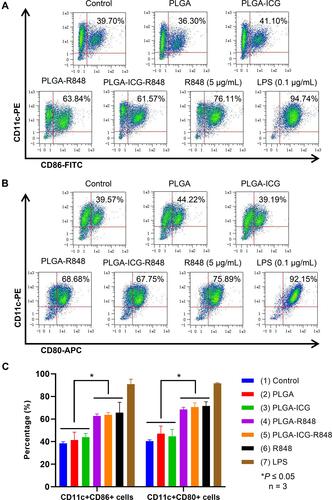
Figure 4 Anti-tumor effect of PLGA-ICG-R848 NPs plus NIR laser in vivo. (A and B) During laser irradiation, the subcutaneous temperatures in groups of PBS+laser and PLGA-ICG-R848+laser were monitored at 2 min, 4 min, 6 min, 8 min and 10 min by FLIR thermal imager. (C) Two weeks after photothermal therapy, in vivo bioluminescence imaging was performed to monitor tumor growth and (D) bioluminescent images were quantified (*P < 0.05, n = 3). (E and F) Spleens were collected after two-week treatment and flow cytometry was used to detect the proportion of NK cells in splenocytes (*P < 0.05, n = 3).
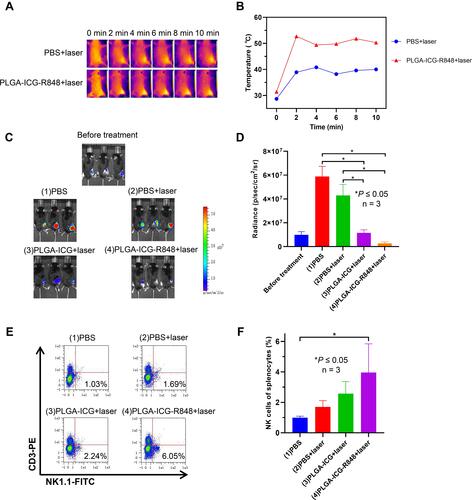
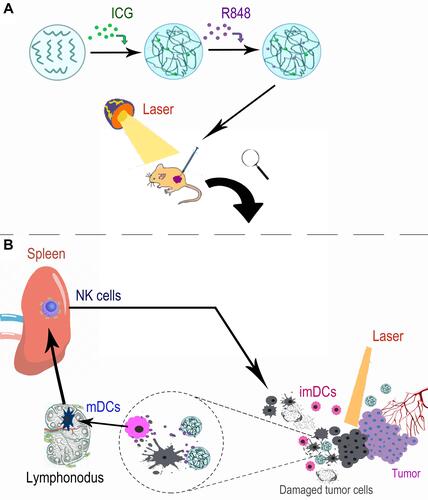
Figure 5 The mechanism of anti-tumor efficacy induced by PLGA-ICG-R848 NPs plus NIR laser. (A) The preparation of PLGA-ICG-R848 NPs and their application in vivo. (B) Schematic illustration of PLGA-ICG-R848 NPs for PTT and anti-tumor immune response against PCa.