Figures & data
Table 1 Composition of the Independent Variables with Their Respective Levels and Their Dependent Variables
Table 2 Formulation Parameters for RP Ethosomal Hydrogel
Table 3 Summarize Statistics Model of Box–Behnken Design Used for Optimization of Ethosomal RP with Their Regression Equation
Figure 1 Response surface plot for the effect of independent variables on (A) particle size, (B) ZP, (C) EE%, (D) % drug released over 24 hr, (E) % drug permeated over 24 hr and (F) desirability of the optimized ethosomal RP formula.
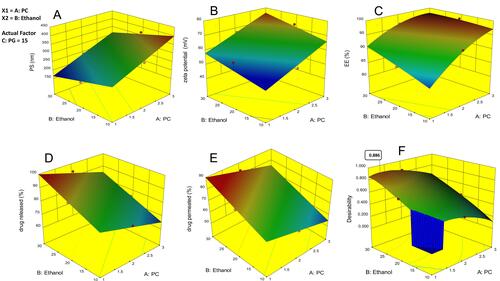
Table 4 Ex vivo Permeation Parameters of Ethosomal RP Formulations
Table 5 Predicted and Experimental Values of the Optimal Ethosomal RP Formulations
Figure 2 Contour plot for the effect of independent variables on (A) particle size, (B) ZP, (C) EE%, (D) % drug released over 24 hr, (E) % drug permeated over 24 hr and (F) desirability of the optimized ethosomal RP formula.
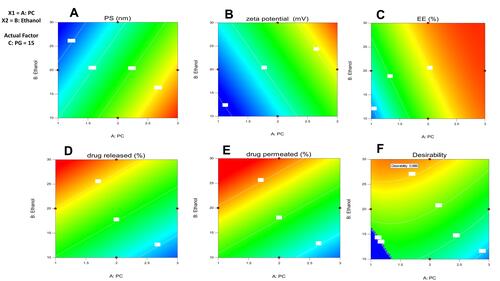
Figure 3 Transmission electron micrograph of the optimized ethosomal RP formulation.
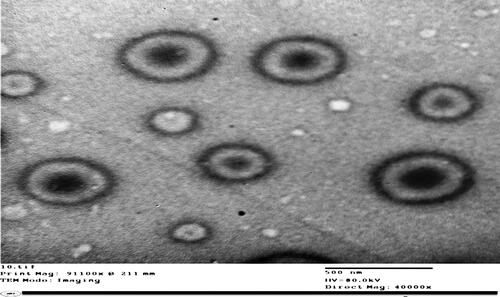
Figure 4 Effect of storage at 4°C and 25°C for 3 months on particle size, ZP and EE % of the optimized Ethosomal RP formula.
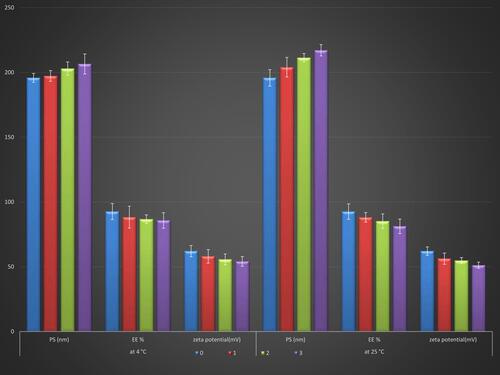
Figure 5 Rheograms of RP hydrogel formulations; G1-G8.
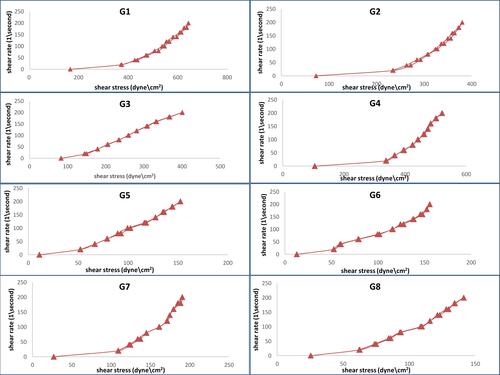
Figure 6 Flow curves of RP hydrogel formulations; G1-G8.
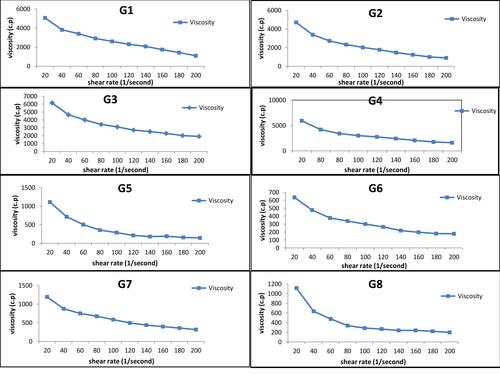
Figure 7 Response surface plot for the effect of independent variables on (A) % drug released over 24 h, (B) % drug permeated over 24 h, (C) desirability of the optimized RP ethosomal hydrogel.
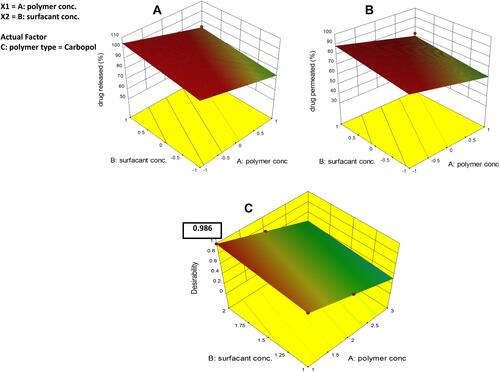
Figure 8 % Drug permeated from control gel and optimized RP ethosomal hydrogel.
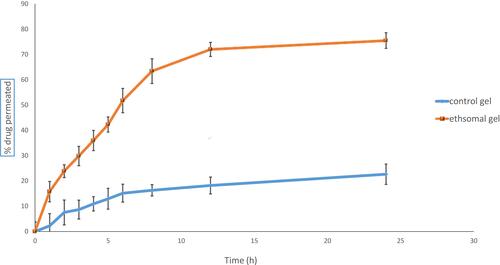
Figure 9 Light photomicrographs showing histopathological sections of (A) rat skin of the control group, (B) rat skin of tretinoin cream treated group, and (C) rat skin of ethosomal RP hydrogel treated group. (H&E stain; Bar= 100μm).
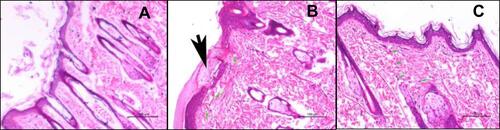
Table 6 Mean Acne Lesion Count Before and After Treatment
Table 7 Local Adverse Effects in the Two Treatment Sides
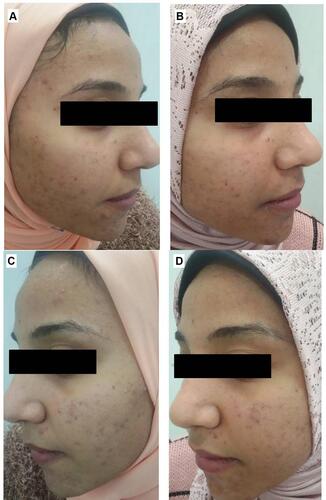
Figure 10 Right side of face before (A) and after topical tretinoin (B). Left side of the face before (C) and after ethosomal RP hydrogel (D). Peeling and dryness noted after topical tretinoin.
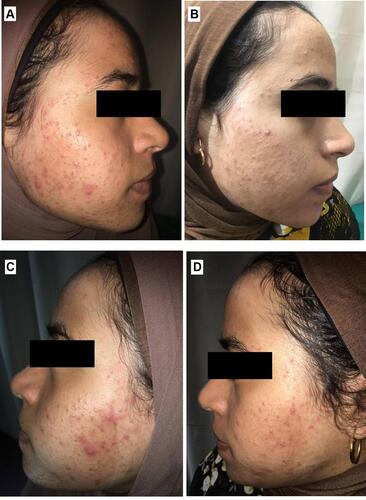
Figure 11 Right side of face before (A) and after topical tretinoin (B). Left side of the face before (C) and after ethosomal RP hydrogel (D). Moderate erythema noted after topical tretinoin.
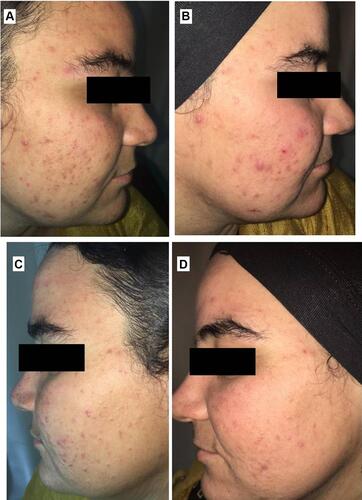
Figure 12 Right side of face before (A) and after topical tretinoin (B). Left side of the face before (C) and after ethosomal RP hydrogel (D).
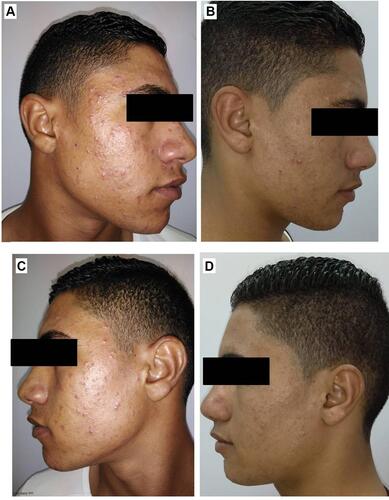
Figure 13 Right side of face before (A) and after topical tretinoin (B). Left side of the face before (C) and after ethosomal RP hydrogel (D).