Figures & data
Figure 1 Schematic illustration of the synthesis of PFOB@LIP-Tet and the therapeutic process.
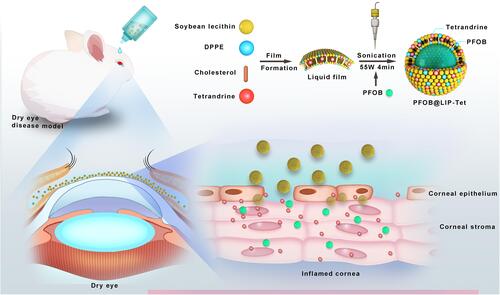
Figure 2 (A) Digital photographs of properties of PFOB@LIP-Tet formulations (1 mg/mL). (B) Size of PFOB@LIP and PFOB@LIP-Tet (100 μg/mL). (C) TEM of PFOB@LIP and PFOB@LIP-Tet (250 μg/mL). (D) PFOB@LIP-Tet size distribution with prolonged time duration. Insert: digital photos of the PFOB@LIP-Tet suspended in PBS (2.5 mg/mL). (E) Zeta potential of PFOB@LIP and PFOB@LIP-Tet (100 μg/mL). (F) UV-vis–NIR absorbance spectra of free Tet, PFOB@LIP, and PFOB@LIP-Tet (50 μg/mL). T-test and Row mean with SD were performed for analysis (P 0.0001).
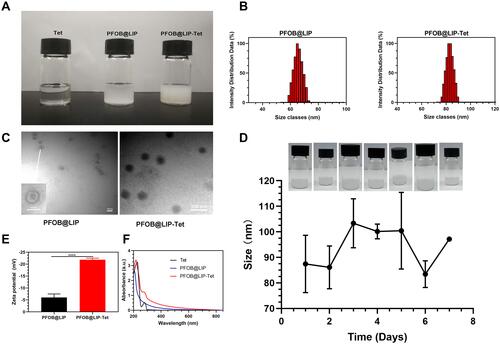
Figure 3 (A) UV–vis–NIR absorbance spectra of Tet at elevated concentrations. (B) A calibration curve of Tet for the quantitation of its loading efficiency. (C) A calibration curve of Tet with concentration from 0.8125 to 100 µg/mL for the quantitation of its cumulative releases. (D) In vitro cumulative release of Tet from PFOB@LIP-Tet in ATS solution at 4°C, 25°C and 33°C. Linear regression was performed.
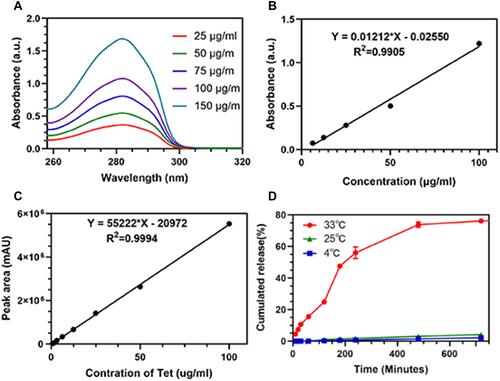
Figure 4 (A) Cell viability of SIRC cells after treated with Tet free in solution or encapsulated in PFOB@LIP-Tet at various concentrations after 24 h and 48 h incubation. (B) Live/dead staining images of SIRC cells treated for 24 h with variant PFOB@LIP-Tet (Tet: 5 µg/mL). Ordinary one-way ANOVA was performed (*P<0.05, **P<0.01, ***P<0.0001).
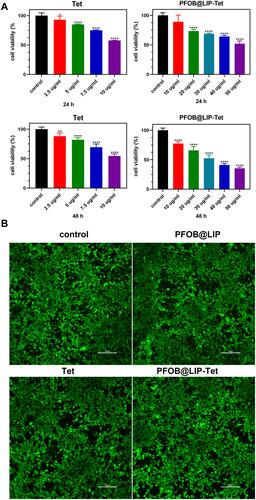
Figure 5 (A) Intracellular uptake of Dil-labeled PFOB@LIP-Tet by SIRC cells with or without being stimulated by LPS observed by CLSM at different intervals (PFOB@LIP-Tet: 100 μg/mL). (B) Flow cytometry detection of intracellular uptake of Dil-labeled PFOB@LIP-Tet (100 μg/mL). (C) Quantitative analysis of flow‐cytometry. Multiple t-tests were performed (*P<0.01).
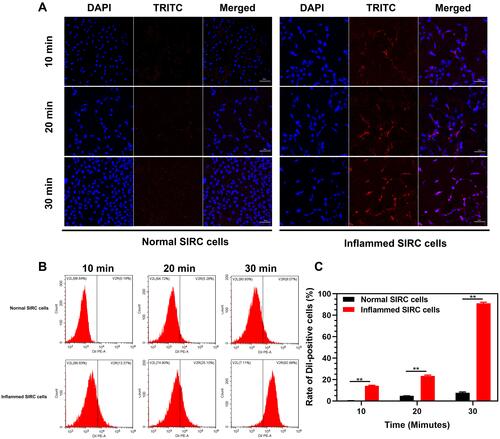
Figure 6 (A) Fluorescence images of DiR-labeled liposomes (PFOB@LIP-Tet: 1 mg/mL) flowed out of eyes at different time intervals. Insert: Schirmer test results of normal rabbit and DED rabbit. (B) Ex vivo fluorescence images of major eye segments dissected from rabbits two hours after DiR-labeled liposomes (PFOB@LIP-Tet: 1 mg/mL) was dropped. (C) Fluorescence images of DiI-labeled liposomes (PFOB@LIP-Tet: 1 mg/mL) in corneal epithelium two hours after liposomes were provided.
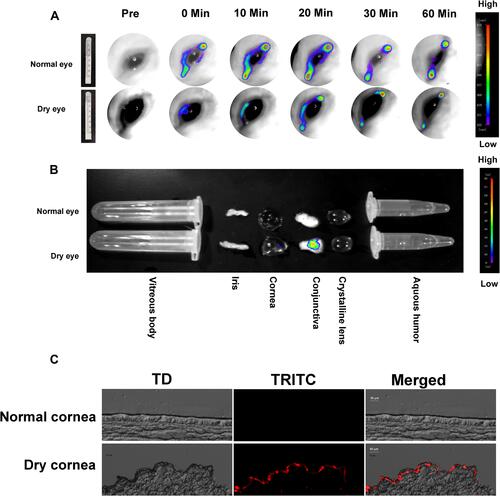
Figure 7 (A) Gene translations of IL-1β, PEG2, VEGF, and TNF-α in normal SIRC cells and inflamed SIRC cells after incubated with PBS PFOB@LIP, Tet and PFOB@LIP-Tet (Tet: 5 μg/mL) for 24 h. (B) Expression of IL-1β, PEG2, VEGF, and TNF-α in normal SIRC cells and inflamed SIRC cells after incubation with PBS PFOB@LIP, Tet and PFOB@LIP-Tet (Tet: 5 μg/mL) for 24 h. The SIRC cells that were stimulated by LPS but not treated by free Tet or liposomes were used as the control group and the SIRC cells that were neither treated with LPS or liposomes were surveyed as normal group. Ordinary one-way ANOVA was performed (*P<0.05, **P<0.01, ***P<0.001, ****P<0.0001).
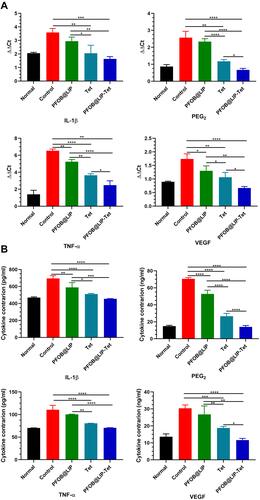
Figure 8 (A) Fluorescein staining images of rabbit cornea after respectively treated by ATS, PFOB@LIP-ATS, Tet-ATS and PFOB@LIP-Tet-ATS for one, three, five, and seven days (Tet: 0.1 mg/mL). (B) Rose Bengal stained images of rabbit corneas after respectively being treated by ATS, PFOB@LIP -ATS, Tet-ATS and PFOB@LIP-Tet-ATS for one, three, five, and seven days (Tet: 0.1 mg/mL). (C) Analysis of staining scores of (A and B) with PFOB@LIP-Tet-ATS serving as the control group. (D) Schirmer test results after a weeks treatment. Ordinary one-way ANOVA and two-way ANOVA were performed (*P<0.05, **P<0.01, ***P<0.0001).
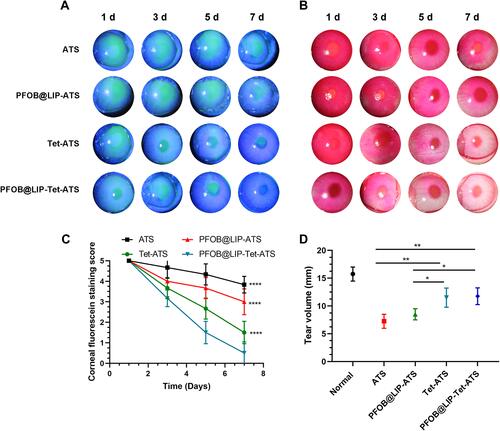
Figure 9 (A) H&E staining of corneas dissected from rabbits of experimental groups and control group and corneal epithelial thickness analysis. (B) TUNEL staining of corneal sections from groups and apoptosis counts analysis. (C) Conjunctival impression cytological images and goblet cell number analysis. Ordinary one-way ANOVA was performed (*P<0.05, **P<0.01, ***P<0.001, ****P<0.0001).
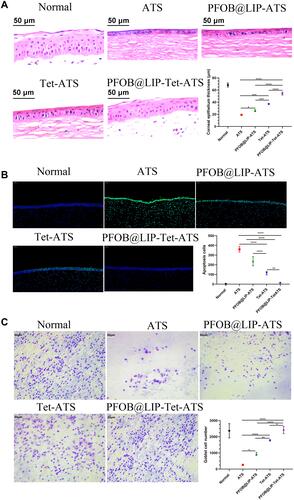
Figure 10 Translation level of gene IL-1β, PEG2, VEGF, and TNF-α in corneas dissected from the rabbits of ATS, PFOB@LIP-ATS, Tet- ATS and PFOB@LIP-Tet-ATS (Tet: 0.1 mg/mL) group after seven days treatment. Ordinary one-way ANOVA was performed (*P<0.05, **P<0.01, ***P<0.001, ****P<0.0001)
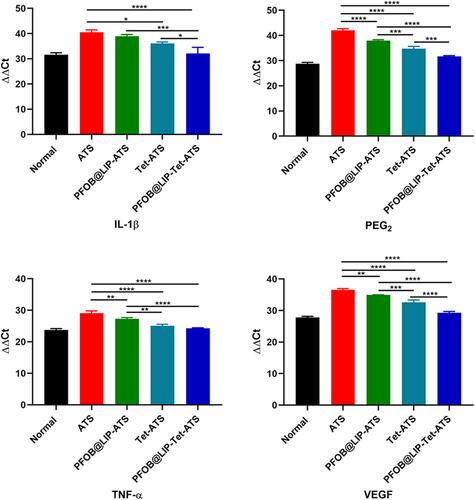
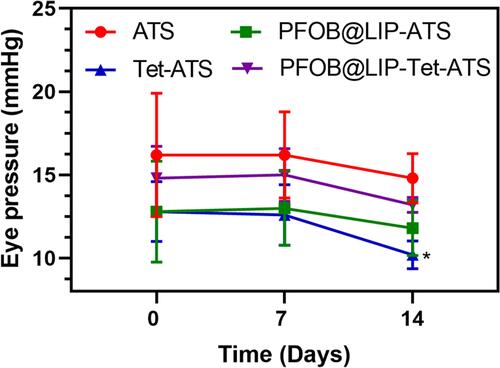
Figure 11 Eye pressure of model eyes detected at 0, 7 and 14 d. Two-way ANOVA was performed for analysis with ATS group serving as the control group (*P<0.05).