Figures & data
Table 1 Absorption Peak Position of Different Functional Groups in the Infrared Spectrum
Table 2 Particle Zeta Potential and Size of GO,GO-PEG, and PGO-OH30 (Mean ± SD, n = 6)
Figure 1 Characterization of nanomaterials based on graphene oxide. (A) Photos of GO and GO-PEG in different physiological solutions (water, saline, medium, and serum) recorded after centrifugation at 10 000g for 5 min. (B) FTIR spectra of GO, GO-PEG, OH30, and PGO-OH30. (C) AFM images of GO, GO-PEG, and PGO-OH30 in tapping mode. (D) TEM images of GO and GO-PEG.The black arrows indicate GO and GO-PEG in the TEM field, respectively.
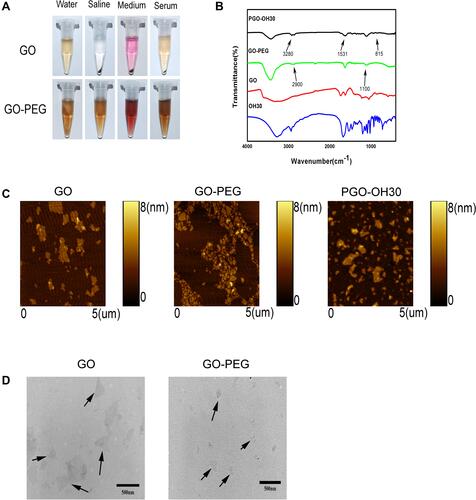
Table 3 Optimization of Loading Capacity and Encapsulation rate.The Loading Efficiency and Encapsulation Rate of GO-PEG Were Detected by HPLC, and Different Proportions of GO-PEG and OH30 Were Mixed to Obtain Better Loading Efficiency and Encapsulation Rate (Mean ± SD, n =3)
Table 4 Optimization of Loading Capacity and Encapsulation Rate.The Loading Efficiency and Encapsulation Rate of GO-PEG Were Detected by HPLC, and Different Proportions of GO-PEG and OH30 Were Mixed to Obtain Better Loading Efficiency and Encapsulation Rate (Mean ± SD n = 3)
Figure 2 In vitro drug-release profile of PGO-OH30 at pH 7.4.PO-OH30 was incubated at 37 °C, and OH30 released from PGO-OH30 was detected by HPLC. Data are represented as the mean ± SD, n = 3.
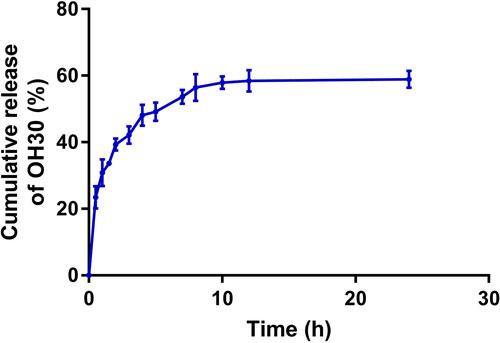
Figure 3 In vitro antibacterial experiment. The OH30 released at different time points were incubated with S. aureus, and the initial bacterial amount was 5×10⁴ CFU/mL, After 18–24 h of incubation, the bacteriostatic rate was calculated by the OD value. Data are represented as the mean ± SD, n = 3.
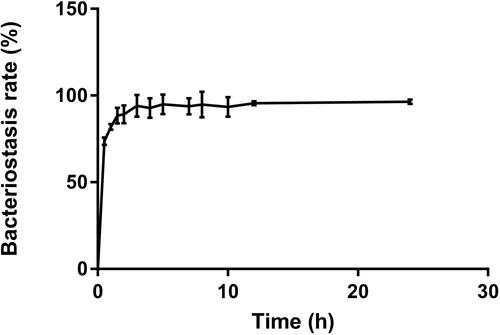
Figure 4 Cytotoxicity of HaCaT. HaCaT cells were incubated with different concentrations of OH30, GO-PEG, and PGO-OH30 for 24 h. Data are represented as the mean ± SD, n = 3.
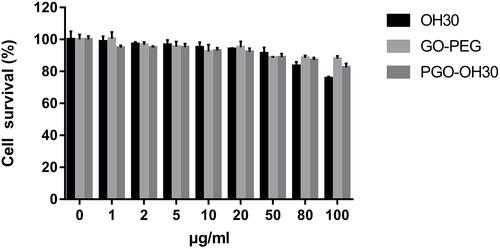
Figure 5 Effect of GO-PEG, OH30, and PGO-OH30 on cell migration. (A) Cell-migration rate from 0 to 48 h. (B) Cell-migration rate from 0 h to 48 h calculated with Image J (mean ± SD, n = 3; *P<0.05 and **P<0.01) .
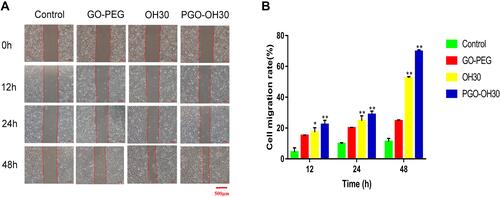
Figure 6 Cytotoxicity of HUVEC. HUVECs were incubated with different concentrations of OH30, GO-PEG, and PGO-OH30 for 24 h. Data are represented as the mean ± SD, n = 3.
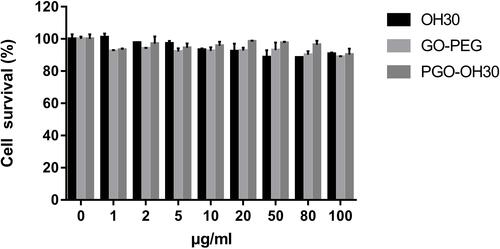
Figure 7 Effect of GO-PEG, OH30, and PGO-OH30 on cell migration. (A) Cell-migration rate from 0 h to 48 h. (B) Cell-migration rate from 0 to 48 h calculated with Image J.
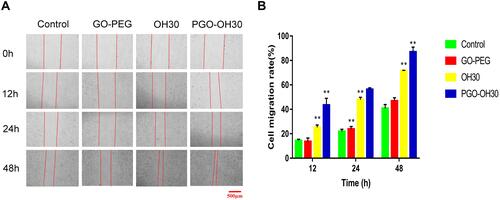
Figure 8 PGO-OH30 promoted the rapid skin-wound repair. (A) Mice with wounds after S. aureus infection were treated with saline, GO-PEG, OH30, or PGO-OH30, respectively. Mouse wound closure on days 3, 7, and 14 was recorded with a camera, and the representative photographs are presented. (B) Wound-healing rate in mice was quantitative analyzed by calculating the area of the wound on days 3,7, and 14. Bars represent the mean ± SD from three replicates. *P<0.05, **P<0.01 vs. control by using one-way ANOVA (n = 8). (C) Quantification analysis of bacterial load in the wound on days 3,7, and 14. Bars represent the mean ± SD from three replicates. **P<0.01 vs. control by using one-way ANOVA (n = 8). All data are representative of at least three independent experiments.
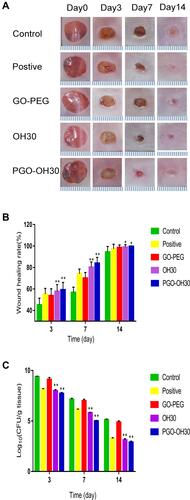
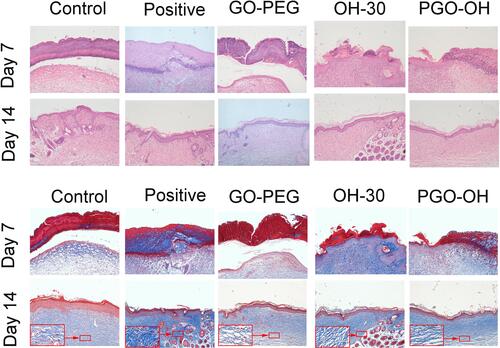
Figure 9 Skin samples were prepared on days 7 and 14 after mice were treated with GO-PEG, OH30, or PGO-OH30. Then, H&E and Masson staining were performed to analyze pathological changes in the skin.