Figures & data
Figure 1 Schematic representation of TSL (A) and CTSL (B) tumor targeting approach in combination with focused HT. TSL circulate through the vasculature after i.v. administration with negligible payload release at body temperature (37°C, NT) (A, I). External active targeting is mediated via local HT to release high concentrations of drug at tumor vascular level leading to drug extravasation (A, II). CTSL circulate in the blood stream and accumulate in tumor vasculature by means of electrostatic interaction with over-expressed negatively charged membrane proteins (B, I and II). After binding, nanoparticles are internalized into tumor endothelial cells (B, III). Regional HT applied via an external device focused on a tumor, triggers drug release from endothelium associated CTSL, delivering high concentrations of the drug intracellularly (B, IV and V).
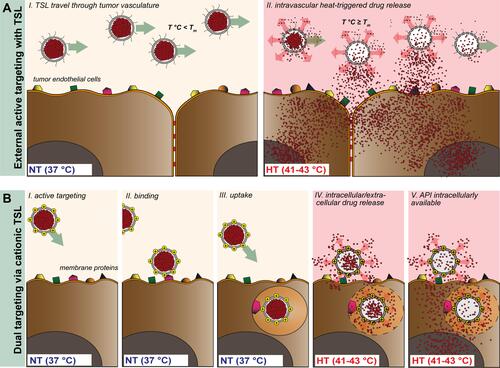
Table 1 Characterization of Anionic and Cationic TSLs Encapsulating DOX
Figure 2 Temperature-dependent DOX release profiles. Percentage of released DOX after either 5 minutes (37–45°C) or 1 hour (37, 42°C) incubation in full FCS for CTSLs (A, D) DPPG2-TSL (B, E), and PEG-TSLs (C, F). Values are expressed as mean value + SD for three independent batches. DOX release after 1 hour incubation at 37 or 42°C was analyzed either via one-way ANOVA followed by Bonferroni test using bare-CTSL as control (D) or via two-tailed t-test (E, F). Asterisks indicate significance different between groups. * p < 0.05, ** p < 0.01, *** p < 0.001, **** p < 0.0001.
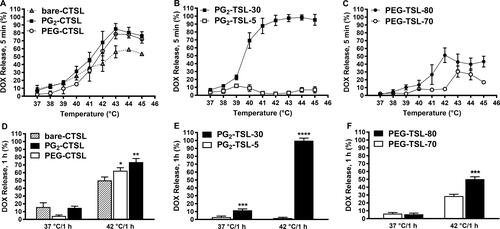
Figure 3 Fluorescence activated cell sorting (FACS) after incubation with rhodamine-labeled (C)TSLs. Iso-PE fluorescence of untreated cells was subtracted from each sample and final MFI plotted as mean value ± SD for three independent measurements. Groups were analyzed via one-way ANOVA followed by Bonferroni test, and asterisks indicate significant differences between groups. * p < 0.05, **** p < 0.0001.
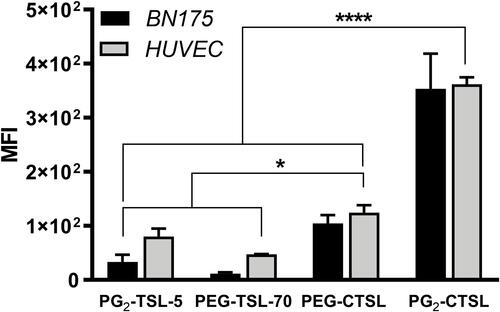
Figure 4 Live cell fluorescence imaging on tumor and endothelial cells after incubation with anionic (first rows) or cationic (second rows) DPPG2- (A, B) or PEG-based TSLs (C, D). NBD-liposome were imaged using GFP filter (green color), lysosomes with DsRed filter (Lysotracker RED, red color) and nuclei with DAPI filter (Hoechst 33342, blue color). Arrows indicate co-localization (yellow) of liposomes (green) and lysosomes (red). Images were taken after 1 hour at 37°C (NT). Scale bar applied to all images is 20 µm.
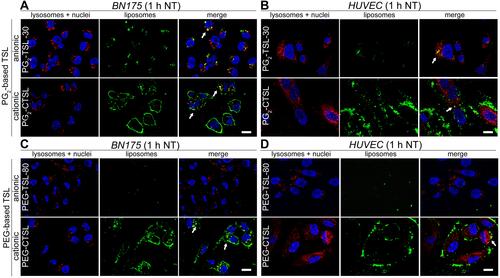
Figure 5 DOX fluorescence imaging on tumor and endothelial cells after incubation with anionic (first rows) or cationic (second rows) DPPG2- (A, B) or PEG-based TSLs (C, D). Cells were imaged using DAPI filter for Hoechst 33342 (nuclei, blue) and DsRed filter for DOX visualization (red). Images were taken after 1 hour at 37°C (NT) and after 1 hour at 41°C (HT). Arrows indicate co-localization of DOX and nuclei. Scale bar applied to all images is 20 µm.
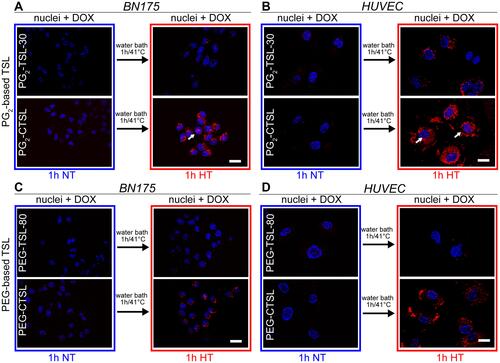
Figure 6 DOX recovery from tumor (A) and endothelial cell lines (B) after incubation with 100 µM DOX either formulated in (C)TSLs or as a free form. DOX and protein content in cell lysates were assessed in cell lysate via HPLC and protein assay, respectively. Results are shown as DOX/protein ratio (µg/mg) and data are presented as mean value ± SD for three independent batches. Groups were analyzed via one-way ANOVA followed by Bonferroni test and asterisks indicate significant differences between groups. *** p < 0.001, **** p < 0.0001, LOD = limit of detection.
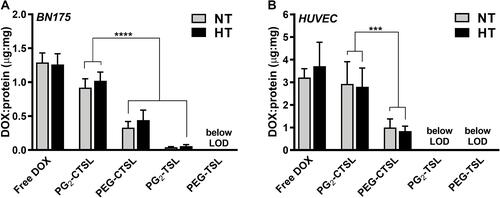
Table 2 IC50 Values DOX of BN175 and HUVEC Treated with Different Liposomal DOX Formulations
Table 3 PK Parameters of DOX-Loaded (C)TSL Formulations
Figure 7 Pharmacokinetic profile of DOX-loaded (C)TSLs in Brown Norway rats. DOX blood levels after administration via PG2-TSL-30 (black circles), PEG-TSL-80 (black squares), PEG-CTSL (white squares), PG2-CTSL (white circles), and free DOX (red triangles and dashed red line). Data were fitted via either a one-phase (EquationEquation 3(3) ) or a two-phases (EquationEquation 4
(4) ) decay formula. Data are presented as mean value ± SD, every group consisted of three animals (n=3). DOX blood content of DPPG2- and PEG-based CTSLs at 2, 60 and 120 min was compared via two-tailed t-test and asterisks indicate significance between groups. * p < 0.05, *** p < 0.001.
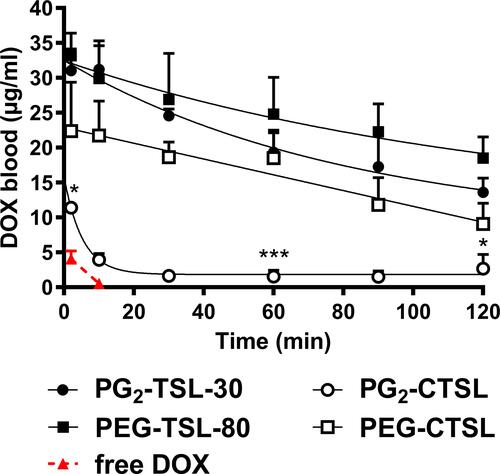
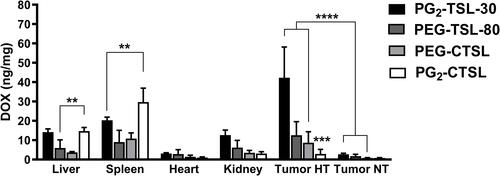
Figure 8 DOX recovery in organs and tumors after i.v. administration of DOX-loaded (C)TSLs in combination with local HT. Data are presented as mean value ± SD, every group consisted of three animals (n=3). Groups were analyzed via two-tailed t-test and asterisks indicate significant differences between groups. ** p < 0.01, *** p < 0.001, **** p < 0.0001.