Figures & data
Figure 1 Synthesis and characterization of PdNPs using nobiletin. (A) Absorption spectra of the nobiletin-mediated synthesis of PdNPs; (B) XRD patterns of PdNPs; (C) FTIR spectra of PdNPs; (D) size distribution analysis of PdNPs using DLS; (E) TEM images of PdNPs; and (F) histogram representing the average sizes of particles obtained from TEM images. At least three independent experiments were performed for each sample, and reproducible results were obtained.
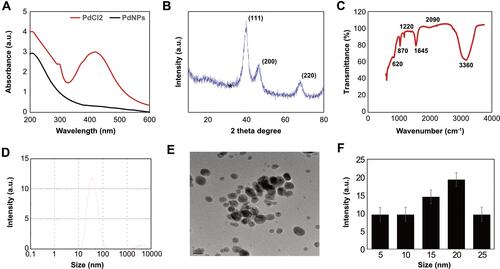
Figure 2 Effects of serum on cell viability, proliferation, exosome protein, and AChE activity on THP-1 cells. THP-1 cells were grown in RPMI-1640 cell culture medium supplemented with 10% fetal calf serum (FCS) or 1% FCS over a 24 h period. (A) Cell viability was determined using the CCK-8 assay. (B) Cell proliferation was determined using BrdU. (C) Total protein concentration of isolated exosomes was determined using BCA. (D) AChE activity was determined from isolated exosomes using a colorimetric method. The results are expressed as the mean ± standard deviation of three independent experiments. The treated groups showed statistically significant differences from the control group by the Student’s t-test; *p <0.05 was considered significant.
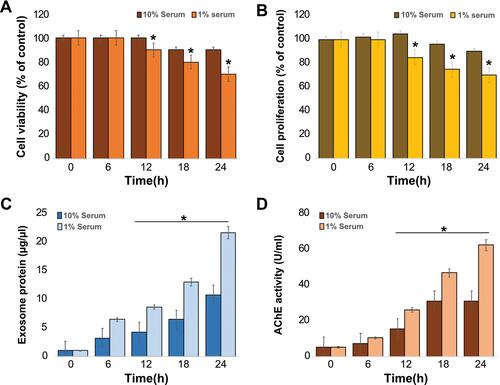
Figure 3 Dose-dependent effects of PdNPs, CSP, and GW4869 on the viability and proliferation of THP-1 cells. THP-1 cells were treated with various concentrations of (A) PdNPs (5–25 µM), (B) CSP (5–25 µM), and (C) GW4869 (5–25 µM) in RPMI-1640 cell culture medium supplemented with 1% FCS for 24 h, and cell viability was determined using CCK-8. Cell proliferation was determined by BrdU in THP-1 cells exposed to (D) PdNPs (5–25 µM), (E) CSP (5–25 µM), and (F) GW4869 (5–25 µM). The results are expressed as the mean ± standard deviation of three independent experiments. The treated groups showed statistically significant differences from the control group by the Student’s t-test; *p <0.05 was considered significant.
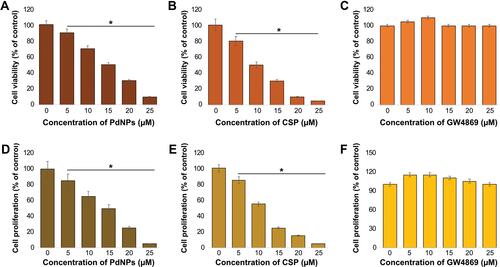
Figure 4 Effect of PdNPs on the cytotoxicity of THP-1 cells. THP-1 cells were treated with PdNPs (15 µM), CSP (10 µM), or GW4869 (20 µM) in RPMI-1640 cell culture medium supplemented with 1% FCS for 24 h. (A) Cell viability was determined using the CCK-8 assay (B). Cell proliferation was determined by BrdU, (C) cell death rate was determined using trypan blue, and (D) LDH leakage was measured at 490 nm using the LDH cytotoxicity kit. The results are expressed as the mean ± standard deviation of three independent experiments. The treated groups showed statistically significant differences from the control group by the Student’s t-test; *p <0.05 was considered significant.
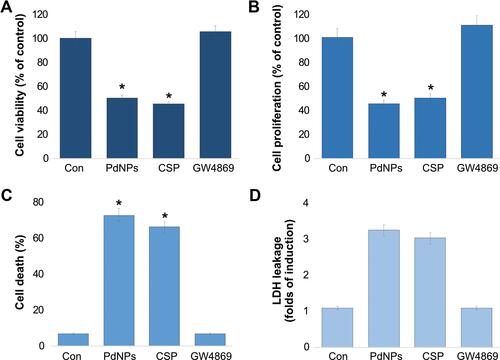
Figure 5 Effect of PdNPs on oxidative stress markers. THP-1 cells were treated with PdNPs (15 µM), CSP (10 µM), or GW4869 (20 µM) in RPMI-1640 cell culture medium supplemented with 1% FCS for 24 h. (A) Spectrophotometric analysis of ROS was performed using 2ʹ,7ʹ-dichlorodihydrofluorescein diacetate (DCFH-DA). (B) Malondialdehyde concentration was measured using a thiobarbituric-acid-reactive substances assay and expressed as nanomoles per gram of protein. (C) Lipid hydroperoxides were extracted and quantified as indicated using the Lipid Hydroperoxide Assay Kit (Catalog No. 705003; Cayman Chemical Company). (D) Nitric oxide production was quantified spectrophotometrically using Griess reagent and expressed as micromoles per gram of protein. (E) Protein carbonylation content was determined and expressed as micromoles per gram of protein. (F) 8-Isoprostane was quantified using the protocol described in the ELISA Kit (Catalog No.516351, Cayman Chemical Company) manual. The results are expressed as the mean ± standard deviation of three independent experiments. The treated groups showed statistically significant differences from the control group by the Student’s t-test; *p <0.05 was considered significant.
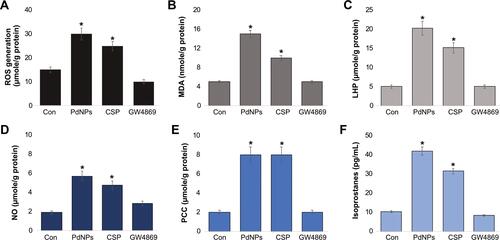
Figure 6 Effect of PdNPs on antioxidants. THP-1 cells were treated with PdNPs (15 µM), CSP (10 µM), or GW4869 (20 µM) in RPMI-1640 cell culture medium supplemented with 1% FCS for 24 h. (A). GSH, (B) TRX, (C) CAT, (D) SOD, (E) GPX, and (F) GST concentrations are expressed as micromoles per milligram of protein. The results are expressed as the mean ± standard deviation of three independent experiments. The treated groups showed statistically significant differences from the control group by the Student’s t-test; *p <0.05 was considered significant.
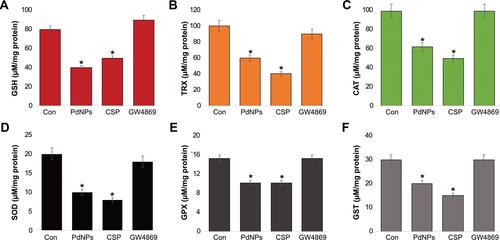
Figure 7 Effect of PdNPs on ER stress. THP-1 cells were treated with PdNPs (15 µM), CSP (10 µM), or GW4869 (20 µM) in RPMI-1640 cell culture medium supplemented with 1% FCS for 24 h. The mRNA expression of ER stress markers including IRE, PERK, ATF-6, ATF-4, GRP78, and CHOP (A–F) were estimated via qRT-PCR. The results are expressed as the mean ± standard deviation of three independent experiments. The treated groups showed statistically significant differences from the control group by the Student’s t-test; *p <0.05 was considered significant.
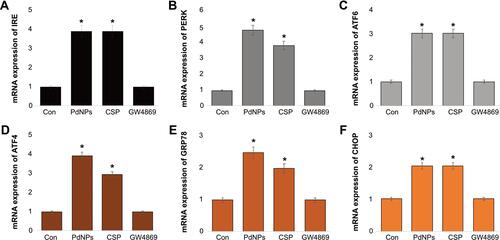
Figure 8 Effect of PdNPs on MMP, caspase 9/3, HNE, 8-OHDG, and 8-OHG in THP-1 cells. THP-1 cells were treated with PdNPs (15 µM), CSP (10 µM), or GW4869 (20 µM) in RPMI-1640 cell culture medium supplemented with 1% FCS for 24 h. Levels of (A) MMP, (B) caspase-9, (C) caspase-3, (D) HNE, (E) 8-Oxo-dG, and (F) 8-Oxo-G were determined. The results are expressed as the mean ± standard deviation of three independent experiments. The treated groups showed statistically significant differences from the control group by the Student’s t-test; *p <0.05 was considered significant.
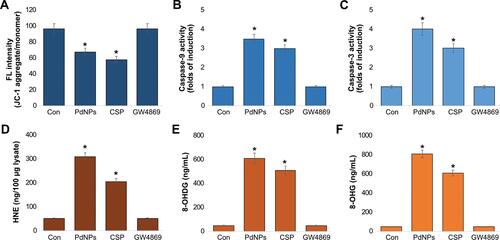
Figure 9 Effect of PdNPs on AChE activity, neutral sphingomyelinase activity, exosomal protein level, and exosome count. THP-1 cells were treated with PdNPs (15 µM), CSP (10 µM), or GW4869 (20 µM) in RPMI-1640 cell culture medium supplemented with 1% FCS for 24 h. (A) AChE activity was determined from isolated exosomes using a colorimetric method. (B) Neutral sphingomyelinase activity was estimated using the Amplex Red sphingomyelinase assay kit. (C) Total protein concentration of exosomes was determined using BCA. (D) Exosomes were isolated by ExoQuick and exosomes counts were determined fluorescence polarization. (E) Exosomes were isolated by ExoQuick and exosomes counts were determined by NTA. (F) Exosomes were isolated by ExoQuick and exosomes counts were determined by EXOCET. The results are expressed as the mean ± standard deviation of three independent experiments. The treated groups showed statistically significant differences from the control group by the Student’s t-test; *p <0.05 was considered significant.
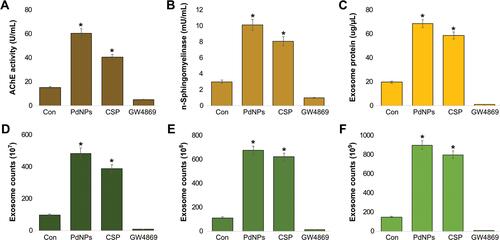
Figure 10 Size, size distribution, and morphological analyses of exosomes. THP-1 cells were treated with PdNPs (15 µM), CSP (10 µM), or GW4869 (20 µM) in RPMI-1640 cell culture medium supplemented with 1% FCS for 24 h. (A) Size distribution of exosomes was determined using DLS and NTA. (B) SEM images of exosomes. (C) TEM images of exosomes. At least three independent experiments were performed for each sample, and reproducible results were obtained.
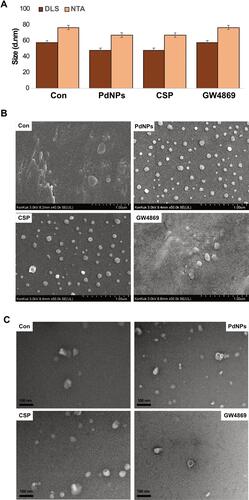
Figure 11 mRNA and protein expression levels of exosomal markers TSG101, CD81, CD63, and CD9. THP-1 cells were treated with PdNPs (15 µM), CSP (10 µM), or GW4869 (20 µM) in RPMI-1640 cell culture medium supplemented with 1% FCS for 24 h. (A) The mRNA (upper panel) and (B) protein (lower panel) expression levels of TSG101, CD81, CD63, and CD9 were analyzed using ELISA. The results are expressed as the mean fold change ± standard deviation from three independent experiments. The treated groups showed statistically significant differences from the control group by the Student’s t-test; *p <0.05 was considered significant.
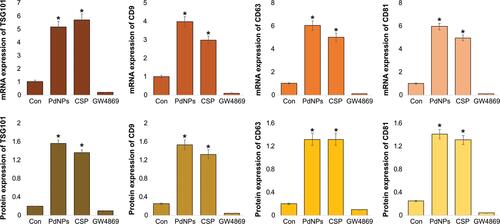
Figure 12 Effects of NAC and GW4869 on the influence of PdNPs on AChE and n- sphingomyelinase activities, exosomal protein level, and exosome count. THP-1 cells were treated with PdNPs (15 µM), CSP (10 µM), or GW4869 (20 µM) in RPMI-1640 cell culture medium supplemented with 1% FCS for 24 h. The cells were pre-treated with either NAC or GW4869. (A) AChE activity was determined in exosomes using a colorimetric method. (B) Neutral sphingomyelinase activity was estimated using the Amplex Red sphingomyelinase assay kit. (C) Total protein concentration of exosomes was determined using BCA. (D) Exosome counts were determined by EXOCET. The results are expressed as the mean fold change ± standard deviation from three independent experiments. The treated groups showed statistically significant differences from the control group by the Student’s t-test; *p <0.05 was considered significant.
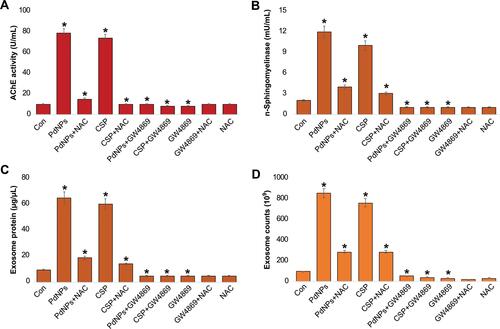
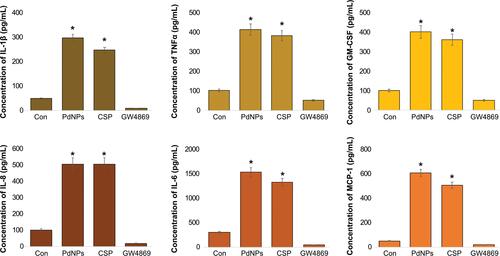
Figure 13 Effects of PdNPs on pro-inflammatory cytokines and chemokines. The expression levels of IL-1β, TNF-α, GM-CSF, IL-8, IL-6, and MCP-1 were measured in exosomes isolated from THP-1 cells exposed to PdNPs (15 µM), CSP (10 µM), or GW4869 (20 µM) in RPMI-1640 cell culture medium supplemented with 1% FCS for 24 h. The results are expressed as the mean ± standard deviation of three independent experiments. The treated groups showed statistically significant differences from the control group by the Student’s t-test; *p <0.05 was considered significant.