Figures & data
Figure 1 TEM images of different synthetic phases of the MNPs. (A) Fe3O4 nanoparticles. (B) OA-modified Fe3O4 nanoparticles. (C) Fe3O4/polystyrene MNPs. (D) Carboxyl-functionalized Fe3O4/polystyrene MNPs.
Abbreviations: OA, oleic acid; MNPs, magnetic nanoparticles; TEM, transmission electron microscopy.
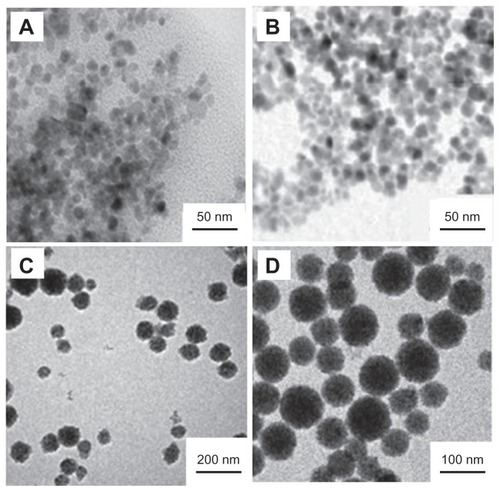
Figure 2 Properties of CdTe QDs. (A) Images of two kinds of CdTe QDs solution under ultraviolet light. (B) HRTEM images of CdTe QDs. (C) Photoluminescence spectra of two kinds of QDs. (D) Absorption spectrum of two kinds of CdTe QDs.
Abbreviations: HRTEM, high-resolution transmission electron microscope; QDs, quantum dots; CdTe, cadmium telluride; au, arbitrary units.
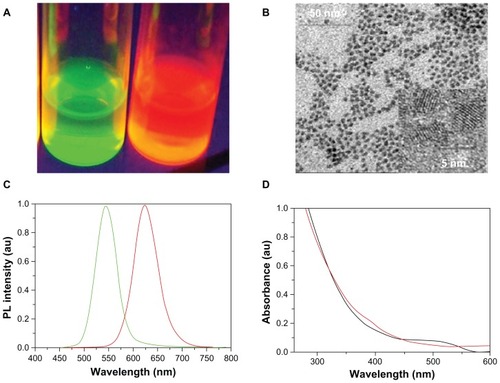
Figure 3 The images of pan-ck protein expression in four kinds of epithelial tumor cells by the ICC method. (A) Lung cancer A549 cells. (B) Lung cancer SPC-A-1 cells. (C) Liver cancer HepG2 cells. (D) Colon cancer HCT-8 cells.
Note: The magnification was 100×.
Abbreviations: ICC, immunocytochemistry; pan-ck, pan-cytokeratin.
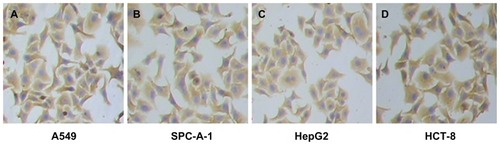
Figure 4 The mean number of enriching cancer cells from the different ratios of cancer cells to PBMC by MNP-pan-ck.
Notes: When the ratio of cancer cells to PBMC is 1:5 × 10⁶ (Group 3), the cancer cells are successfully enriched by MNP-pan-ck, and when the ratios of cancer cells to PBMC increases, the ability to enrich cancer cells is increased. The ratios of cancer cells to PBMC: Group 1, only PBMC; Group 2, 1:107; Group 3, 1:5 × 10⁶; Group 4, 1:106; Group 5, 1:5 × 10⁵; Group 6, 1:105; Group 7, 1:5 × 10⁴; Group 8, 1:104.
Abbreviations: PBMC, peripheral blood mononuclear cells; MNP-pan-ck, MNPs coupled with pan-cytokeratin antibody.
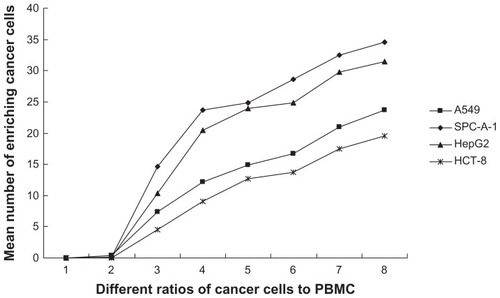
Figure 5 H&E-stained cancer cells enriched by MNPs. (A) A549 cells. (B) SPC-A-1 cells. (C) HepG2 cells. (D) HCT-8 cells. (E) No cells are enriched in the PBMC group.
Note: The magnification was 100×.
Abbreviations: H&E, hematoxylin and eosin; MNPs, magnetic nanoparticles; MNP-pan-ck, MNPs coupled with pan-cytokeratin antibody.
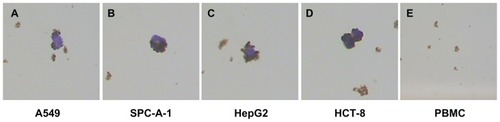
Figure 6 Imaging Lunx and SP-A protein expression in different cancer cells with the ICC method. Following ICC with anti-human Lunx or SP-A Ab, the results were observed in the cytoplasm of different kinds of cancer cells. The brown-colored deposits (arrows) located in the cytoplasm of cancer cells indicates that the cancer cells express the protein. The magnification was 100×. Lunx protein can be expressed in A549 (A) and SPC-A-1 lung cancer cells (B). Lunx protein can not be expressed in HepG2 (C) and HCT-8 cancer cells (D). SP-A protein can be expressed only in A549 lung cancer cells (E). SP-A protein can not be expressed in SPC-A-1 lung cancer cells (F), HepG2 (G) and HCT-8 cells (H).
Abbreviations: ICC, immunocytochemistry; SP-A, surfactant protein-A; Ab, antibody.
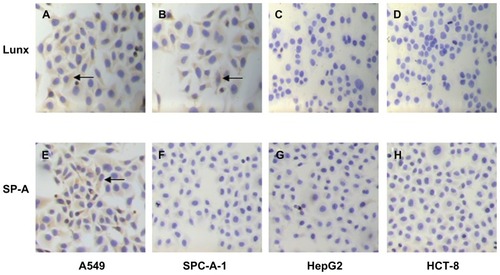
Figure 7 QDs with labeled Abs show Lunx and SP-A protein expression in different cancer cells. A549 cells (A) and SPC-A-1 cells (B) labeled with QD552-Lunx show green fluorescence. A549 cells (E) labeled with QD625-SP-A show red fluorescence and SPC-A-1 cells (F) labeled with QD625-SP-A do not show red fluorescence. A549 cells labeled with both QD552-Lunx and QD625-SP-A show both green and red fluorescence (I). SPC-A-1 cells labeled with both QD552-Lunx and QD625-SP-A show green fluorescence (J). Neither HepG2 nor HCT-8 cells emit any fluorescence signal (C, D, G, H, K and L).
Note: The magnification was 100×.
Abbreviations: Abs, antibodies; SP-A, surfactant protein-A; QDs, quantum dots.
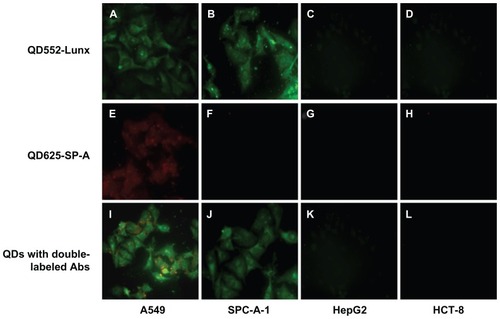
Figure 8 QDs with double-labeled Abs were used to identify the four kinds of enriched cancer cells. (A) A549 cells show green and red fluorescence. (B) SPC-A-1 cells show green fluorescence. HepG2 cells (C) and HCT-8 cells (D) do not express Lunx and SP-A proteins, no fluorescence signal was observed.
Note: The magnification was 200×.
Abbreviations: Abs, antibodies; MNP-pan-ck, MNPs coupled with pan-cytokeratin antibody; PBMC, peripheral blood mononuclear cell; QDs, quantum dots.
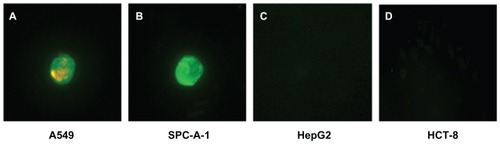
Table 1 The isolated and identified results of different groups
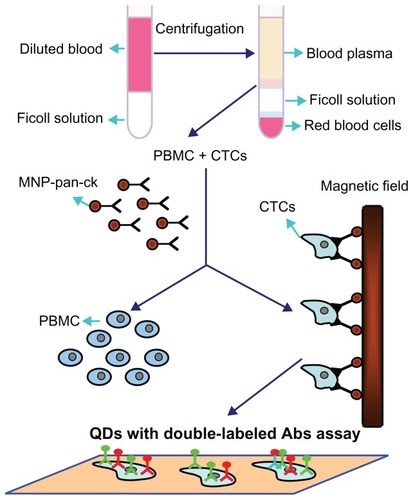
Figure 9 Schematic illustration of the isolation and identification of CTCs with MNP-pan-ck and QDs with double-labeled antibody.
Abbreviations: Abs, antibodies; CTCs, circulating tumor cells; MNP-pan-ck, MNPs coupled with pan-cytokeratin antibody; PBMC, peripheral blood mononuclear cell; QDs, quantum dots.