Figures & data
Figure 1 Micro-CT procedure. (A) Tomograms of the tight region at 0, 2, 13, and 24 hours after injection; the femur zone has been subtracted to calculate the volume fraction of the Endorem-marked cells. Some marked cells are necessarily cut out in this way, but their amount is negligible with respect to the total amount present in the region of interest. (B) Histogram and detail for the investigated mouse, injected with 500,000 cells.
Abbreviation: CT, computed tomography.
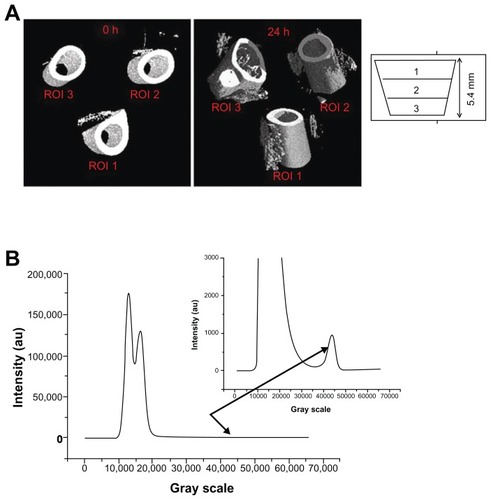
Figure 2 Endorem+ CD133+ stem cells.
Notes: CD133+ stem cells labeled with iron oxide nanoparticles (Endorem). Cells were stained with Prussian blue and taken at 40× magnification.
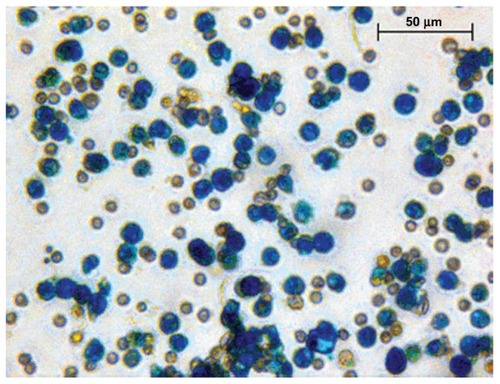
Figure 3 Micro-CT images of injected muscle. (A) Reconstruction of the muscle injected with human cells and its muscle compartments. (B) Images of micro-CT showing the distribution of the cells after each time-point.
Abbreviation: CT, computed tomography.
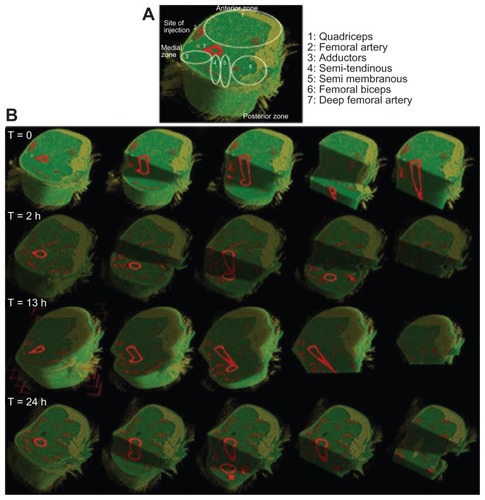
Figure 4 Quantification of different volumes in the investigated ROI.
Notes: Overlapping of the fat + muscle signal for the four measurements in mice injected with 500,000 cells: from the left, the first peak corresponds to air; the second one is an overlapping of the signal coming from fat and muscle. In the magnification, the third one comes from labeled cells and bone.
Abbreviation: ROI, region of interest.
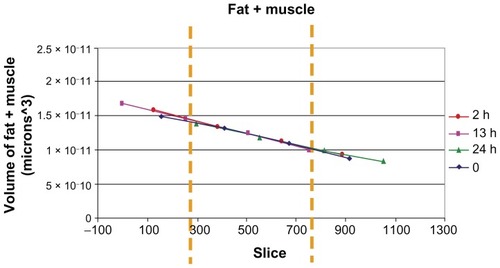
Figure 5 Endorem volume fraction in injected muscles.
Note: The apparent Endorem volume fraction increased up to two hours, then in reached a plateau and remained constant until 24 hours.
Abbreviation: ROI, region of interest.
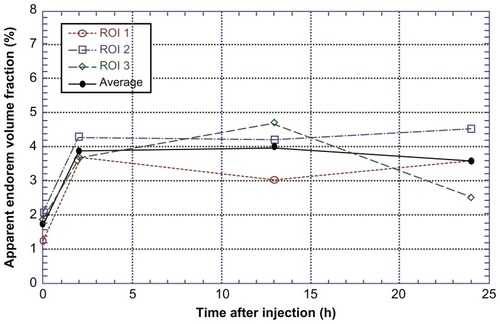
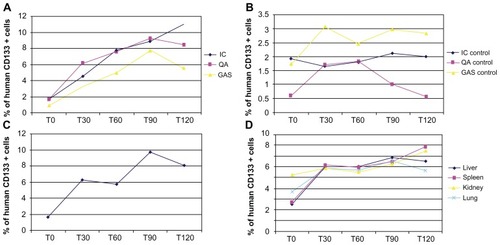
Figure 6 Q-PCR analysis of injected muscles and organs. Q-PCR of injected scid/mdx mice euthanized 0, 30 minutes, 60 minutes, 90 minutes, and 2 hours after cellular transplantation: the graphs are related to (A) muscles of injected leg; (B) muscles of contralateral leg; (C) DIA; and (D) organs.
Abbreviations: DIA, diaphragm; Q-PCR, real-time polymerase chain reaction.