Figures & data
Figure 1 Microemulsion droplet size measured by NanoSight (NanoSight Ltd, Amesbury, UK). (A) Droplet size and relative intensity. (B) Still frame of a video of microemulsion droplets.
Note: The droplets appear as bluish-green spots (taken using NanoSight).
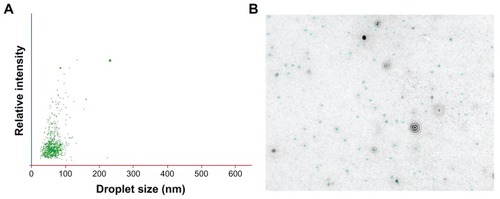
Figure 2 Transmission electron microscopy image of Evo- and Rut-loaded microemulsion (stained with uranyl acetate).
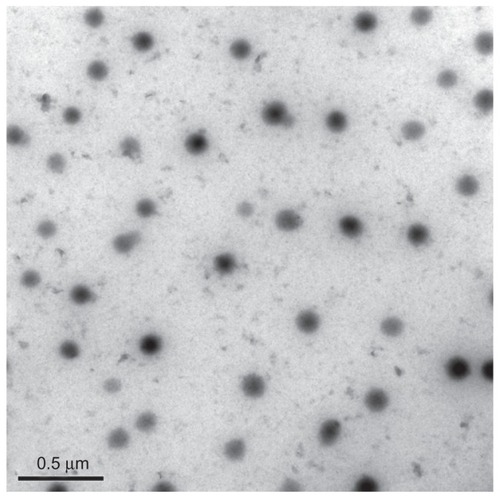
Figure 3 Effect of microemulsion concentration on the amount of Evo (blue) and Rut (red) uptake by mouse skin fibroblasts.
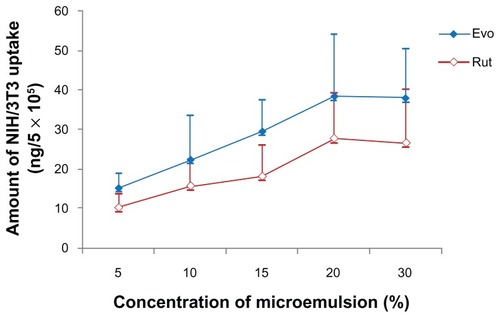
Figure 4 Effect of microemulsion incubation time on the amount of Evo and Rut uptake by mouse skin fibroblasts.
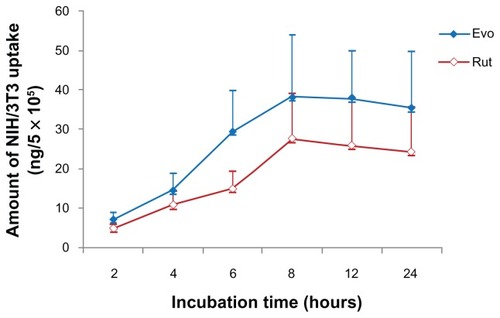
Table 1 Size distribution and droplet concentration statistics of microemulsion by NanoSight
Figure 5 Effect of different formulations (A) microemulsion, (B) tincture, and (C) aqueous suspension, on the amount of Evo and Rut uptake by mouse skin fibroblasts.
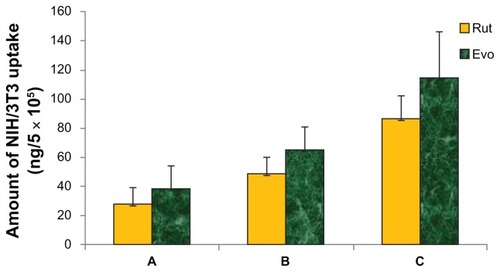
Figure 6 Influence of incubation with different formulations: (A) tincture; (B) aqueous suspension; (C) microemulsion; and (D) microemulsion without Evo and Rut on cellular morphology.
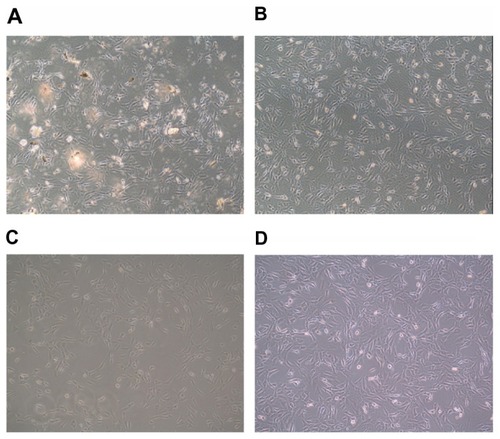
Figure 7 Influence of microemulsion concentration on cellular morphology.
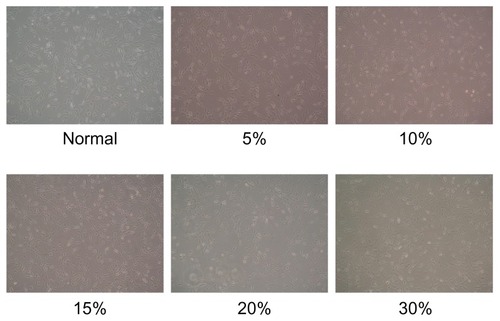
Figure 8 Influence of microemulsion incubation time on cellular morphology.
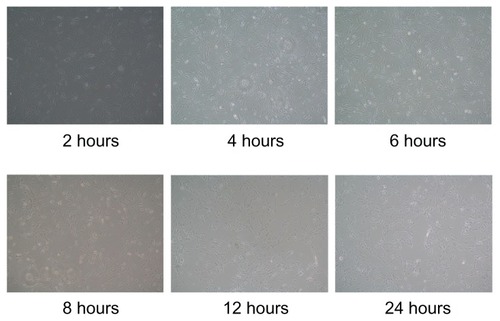
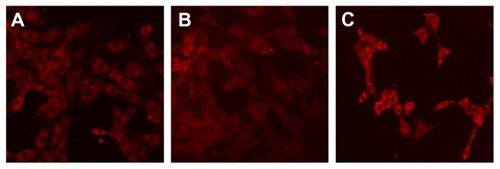
Figure 9 LSCM images showing different concentrations of rhodamine B-labeled microemulsion incubated with mouse skin fibroblasts.
Abbreviation: LCSM, laser scanning confocal microscopy.
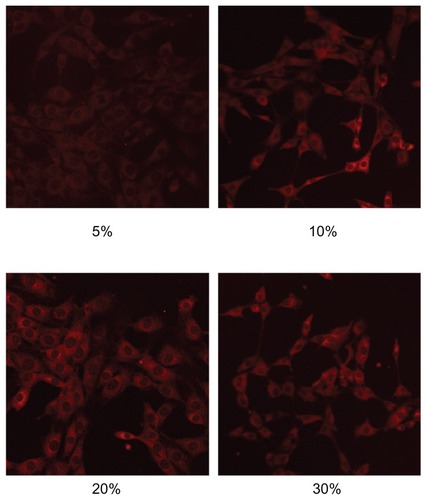
Figure 10 LSCM images showing mouse skin fibroblasts incubated with rhodamine B-labeled microemulsion for different incubation times.
Abbreviation: LCSM, laser scanning confocal microscopy.
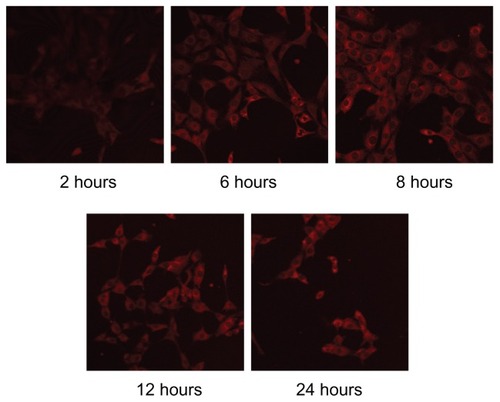
Figure 11 LSCM images showing rhodamine B-labeled formulations (A) microemulsion; (B) tincture; and (C) aqueous suspension.
Abbreviation: LCSM, laser scanning confocal microscopy.