Figures & data
Figure 1 Pictures of (A) sonicated liposomes loaded with polar-coated EMG-1500 USPIOs and (B) extruded sMLs encapsulating dextran-coated Molday-Ion USPIOs.
Note: Photographs were taken a few hours after purification, and samples were kept at room temperature.
Abbreviation: USPIOs, ultrasmall superparamagnetic iron oxides.
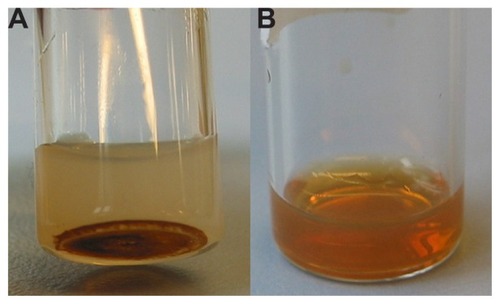
Table 1 Iron quantification via colorimetric assay using KSCN and encapsulation efficiency estimation of purified Molday-Ion sMLs
Figure 2 TEM micrographs of (A) dextran-coated Molday-Ion USPIOs (1.7 mg Fe/mL) in an aqueous buffer directly observed under the microscope; (B) sMLs loaded with Molday-Ion USPIOs at a final iron concentration of 1.7 mg Fe/mL (after extrusion and purification); and (C) extruded control liposomes without magnetite.
Abbreviations: sMLs, stealth magnetic liposomes; TEM, transmission electron microscope; USPIOs, ultrasmall superparamagnetic iron oxides.
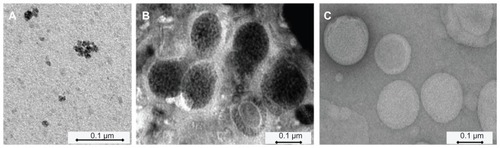
Table 2 Anisotropy values (<r>) of empty and Molday-Ion-loaded sMLs of different lipid compositions
Figure 3 Saturation magnetization values (emu/cm3) of Molday-Ion sMLs compared to free Molday-Ion USPIOs, as a function of the Fe concentration (mg/mL).
Note: The points on the diagram represent the mean value of three experiments (±SD).
Abbreviations: sMLs, stealth magnetic liposomes; USPIOs, ultrasmall superparamagnetic iron oxides.
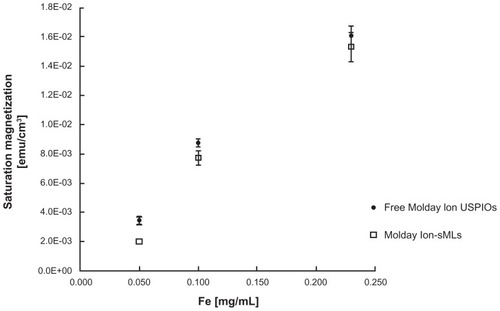
Figure 4 T2-weighted image (A) and T1-weighted scan (B) of either Molday-Ion sMLs (upper part in panels A and B) or EMG-1500sMLs (lower part in panels A and B) in 1% agarose gel phantoms.
Notes: The final CFe (mg/mL) values correspond to the actual concentrations used for the MRI measurements shown here. Agarose gel and empty liposome are the control samples used as a reference.
Abbreviations: sMLs, stealth magnetic liposomes; CFe, iron concentration; MRI, magnetic resonance imaging; agar, agarose gel; EL, empty liposome; ctrl, control.
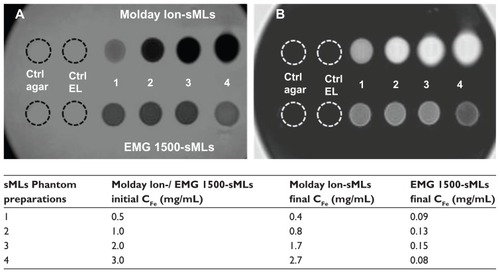
Figure 5 Behavior of the kidneys, liver, and muscle.
Notes: Panels (A-I and B-I) display the signal behavior of the kidneys; panels (A-II and B-II) display the signal behavior of the liver; and panels (A-III and B-III) display the signal behavior of the muscle over time.
Abbreviations: sMLs, steath magnetic liposomes; USPIOs, ultrasmall superparamagnetic iron oxides.
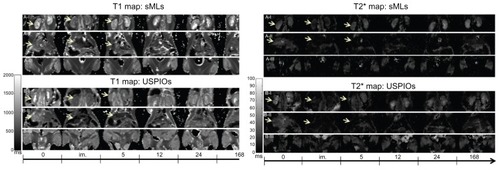
Figure 6 Relative changes in relaxation times (qT1, qT2*) of muscle, liver, and kidneys after injection of clinical doses of 50 μmol Fe/Kg body weight in wild type mice.
Notes: Signal changes were acquired at different time points (0 minutes, 5 minutes, 5 hours, 12 hours, 24 hours, 7 days) after administration of sMLs (A and C) and Molday- Ion USPIOs (B and D), respectively. A strong signal reduction was observed in liver and kidneys for both sMLs and USPIOs 5 minutes after sample administration. No visible change was measured in the muscles.
Abbreviations: sMLs, stealth magnetic liposomes; USPIOs, ultrasmall superparamagnetic iron oxides; h, hours; d, days.
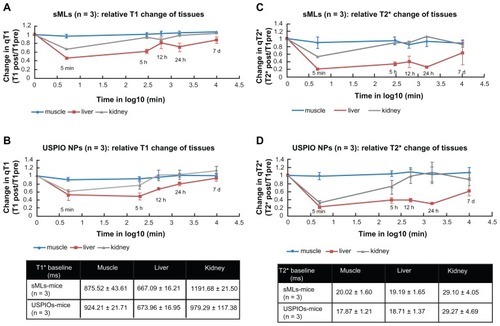
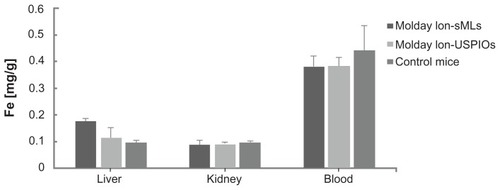
Figure 7 Quantification of iron in liver, kidneys, and blood by ICP-OES of control mice (n = 3) and injected mice 8 days after administration of sMLs and Molday-Ion USPIOs (n = 3 for each).
Note: The values are means ± SD.
Abbreviations: sMLs, stealth magnetic liposomes; USPIOs, ultrasmall superparamagnetic iron oxides, SD, standard deviation.