Figures & data
Figure 1 Transmission electron micrographs of nanoparticles. (A) 2.7 nm quantum dots. (B) 4.7 nm quantum dots. (C) 50 nm SiO2 nanoparticles.
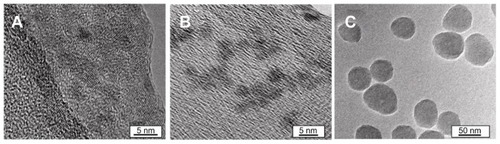
Table 1 Properties of quantum dots and silica nanoparticles used in the present experiments
Figure 2 High content analysis to determine the cytotoxic effects of nanoparticles on human umbilical vein endothelial cells. Cells grown in 96-well plates were treated with or without (N/T) negatively charged QD2.7, QD4.7, or NP50 or with positively charged QD ([+] CTRL) for (A) 20 minutes, (B) 4 hours, (C) 8 hours, or (D) 24 hours and then fixed with 3% formaldehyde.
Notes: Cells were stained with Hoechst to visualize the nuclei and rhodamine phalloidin to visualize the cell morphology. Images were acquired with the use of an IN Cell Analyzer automated microscope, and cell populations were automatically quantified with the use of IN Cell Investigator Software. Data are given as the fold change in the cell number as compared with untreated control cells from three independent experiments performed in triplicate. *P < 0.05; **P < 0.01; ***P < 0.001.
Abbreviation: QD, quantum dot(s).
![Figure 2 High content analysis to determine the cytotoxic effects of nanoparticles on human umbilical vein endothelial cells. Cells grown in 96-well plates were treated with or without (N/T) negatively charged QD2.7, QD4.7, or NP50 or with positively charged QD ([+] CTRL) for (A) 20 minutes, (B) 4 hours, (C) 8 hours, or (D) 24 hours and then fixed with 3% formaldehyde.Notes: Cells were stained with Hoechst to visualize the nuclei and rhodamine phalloidin to visualize the cell morphology. Images were acquired with the use of an IN Cell Analyzer automated microscope, and cell populations were automatically quantified with the use of IN Cell Investigator Software. Data are given as the fold change in the cell number as compared with untreated control cells from three independent experiments performed in triplicate. *P < 0.05; **P < 0.01; ***P < 0.001.Abbreviation: QD, quantum dot(s).](/cms/asset/7f156fee-45f0-412a-aa77-8e5ef5289183/dijn_a_30624_f0002_b.jpg)
Figure 3 Uptake of CdTe-QD and NP50 by human umbilical vein endothelial cells (HUVEC) under controlled shear stress conditions.
Notes: Cell monolayers were exposed under a constant pressure of 0, 0.05, 0.1, or 0.5 Pa with negatively charged QD2.7, QD4.7, or NP50 for 20 minutes. The cellular uptake of nanoparticles was quantified with the use of high content analysis. Data represent the mean ± the standard error of the mean of three independent experiments performed in triplicate. *P < 0.05; **P < 0.01 as compared with inactivated cells at 0.05 Pa; ≠P < 0.05 as compared with TNF-α–activated cells at 0.05 Pa.
Abbreviations: QD, quantum dot(s); RFU, Relative fluorescence units; TNF, tumor necrosis factor.
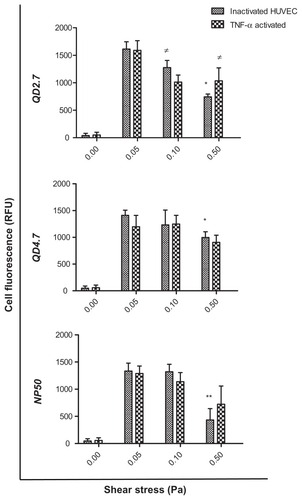
Figure 4 Cellular localization of negatively charged nanoparticles in human umbilical vein endothelial cells (HUVECs). HUVEC monolayers were exposed to (A) QD2.7, (B) QD4.7, and (C) NP50 suspended in phosphate buffered saline under static conditions or at a shear stress (SS) rate of 0.05 Pa for 20 minutes under various conditions as indicated. Samples were then fixed and stained for confocal microscopy studies. The localization of particles in HUVECs exposed (SS+) or not exposed (SS−) to SS was compared. The left panel shows confocal images that demonstrate the compartmentalization of QD2.7 in live untreated (a and b) live treated (c and d), and fixed/permeabilized (e and f) HUVECs. The middle panel shows confocal images that demonstrate the compartmentalization of QD4.7 in live untreated (g and h), live treated (i and j), and fixed/permeabilized (k and l) HUVECs. The right panel shows confocal images that demonstrate the compartmentalization of NP50 in live untreated (m and n), live treated (o and p), and fixed/permeabilized (q and r) HUVECs.
Notes: These images are representative of three independent experiments. The arrows indicate the location of the quantum dots or nanoparticles.
Abbreviation: QD, quantum dot(s).

Figure 5 Cytoskeletal reorganization induced by shear stress (SS). Cells were stained (red, actin; blue, nucleus) for confocal analysis while they were fixed with glutaraldehyde and left in PBS for liquid phase atomic force microscopy studies. Images of human umbilical vein endothelial cells (HUVECs) exposed to static (SS−) and shear stress (SS+) conditions are shown. Confocal microscopy images show actin distribution in HUVECs exposed to (A) static conditions, (B) shear stress, (C) quantum dots, and (D) nanoparticles (NP50). Atomic force microscopy (AFM) images show the surface topography of HUVECs exposed to (E) static conditions, (F) shear stress, (G) quantum dots, and (H) nanoparticles (NP50).
Notes: Images are representative of three independent experiments, and they show shear-induced cytoskeletal (actin) reorganization (yellow arrows), membrane ruffling (arrowheads), and stress fibers (black arrows). Cells exposed to NP50 (G and H) did not demonstrate any cytoskeletal reorganization.
Abbreviation: QD, quantum dots.
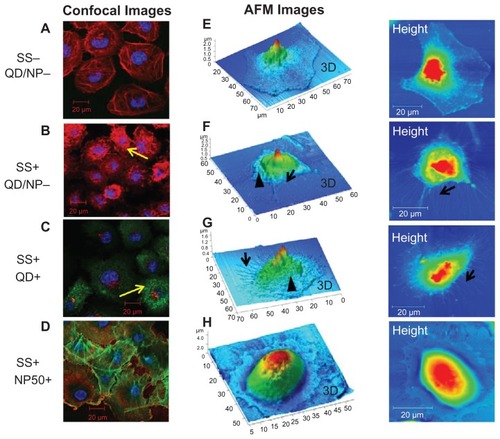
Figure S1 Regulated shear stress assays – VenaEC™ Biochip protocol: Image explains assembly of HUVEC-grown substrate for CdTe-QD and SiO2-NP uptake assays under regulated flow conditions.
Abbreviations: QD, quantum dot(s); NP, nanoparticle(s); HUVEC(s), human umbilical vein endothelial cell(s); EC, endothelial cell(s); SS, shear stress; PDMS, polydimethylsiloxane.
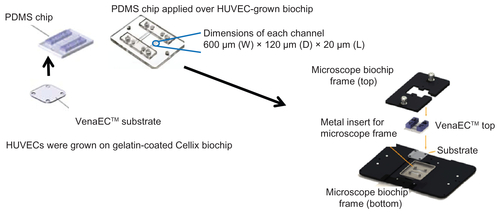
Figure S2 Effect of Triton X detergent concentrion range (0, 0.001, 0.01, 0.1 and 0.5%) on live HUVEC actin-cytoskeletal filaments: HUVECs were grown on 8 chamber slides. After 24 h, cells (A) were treated with 0.001% (B), 0.01% (C), 0.1% (D) or 0.5% (E) Triton X in cell culture medium for 1 h at 37°C.
Notes: Cells not treated with Triton X were taken as control. After staining (actin-red, nucleus-blue) the chambers were removed, cells were covered with a glass cover slip using mounting medium and left at 4°C overnight. Confocal images (maximal projection) are shown. Images are representative of three independent experiments. Arrows point to the areas with disorganized actin.
Abbreviations: NP, nanoparticle(s); HUVEC(s), human umbilical vein endothelial cell(s); EC, endothelial cell(s); SS, shear stress.
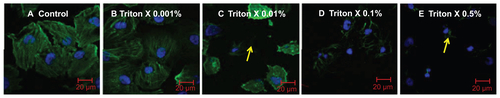
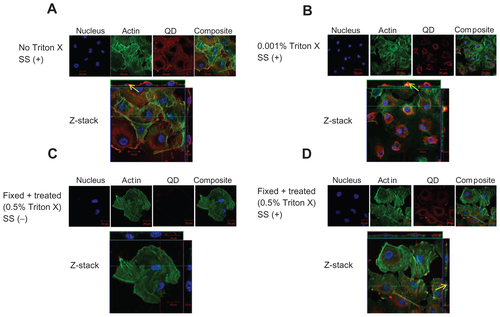
Figure S3 Localization of negatively charged 2.7 nm CdTe-QD in HUVECs. HUVECs were exposed to QD under various conditions. Z-stack (single slice) images of HUVECs showing localization of QD in the following conditions. (A) Z-stack showing intra-cytoplasmic localization of QD in untreated cells under shear stress conditions (0.05 Pa); (B) Z-stack showing intra-cytoplasmic localization of QD in cells which are treated with 0.001% Triton X and exposed to QD under shear stress conditions (0.05 Pa); (C) Z-stack showing both intra-cytoplasmic and intra-nuclear localization of QD in fixed/permeabilized cells under static conditions; (D) Z-stack showing both intra-cytoplasmic and intra-nuclear localization of QD in fixed/permeabilized cells under shear stress conditions (0.05 Pa).
Notes: Images are representative of three independent experiments. Arrows: location of 2.7 nm QD.
Abbreviations: QD, quantum dot(s); NP, nanoparticle(s); HUVEC(s), human umbilical vein endothelial cell(s); EC, endothelial cell(s); SS, shear stress.
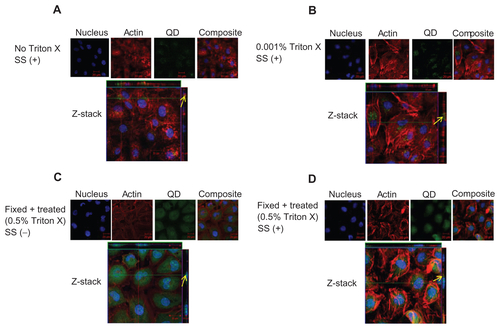
Figure S4 Localization of negatively charged 4.7 nm CdTe-QD in HUVECs. HUVECs were exposed to QD under various conditions. Z-stack (single slice) images of HUVECs showing localization of QD in the following conditions. (A) Z-stack showing intra-cytoplasmic localization of QD in untreated cells under shear stress conditions (0.05 Pa); (B) Z-stack showing intra-cytoplasmic localization of QD in cells which are treated with 0.001% Triton X and exposed to QD under shear stress conditions (0.05 Pa); (C) Z-stack showing perinuclear localization of QD in fixed/permeabilized cells under static conditions; (D) Z-stack showing intra-cytoplasmic localization of QD in fixed/permeabilized cells under shear stress conditions (0.05 Pa).
Notes: Images are representative of three independent experiments. Arrows: location of 4.7 nm QD.
Abbreviations: QD, quantum dot(s); NP, nanoparticle(s); HUVEC(s), human umbilical vein endothelial cell(s); EC, endothelial cell(s); SS, shear stress.
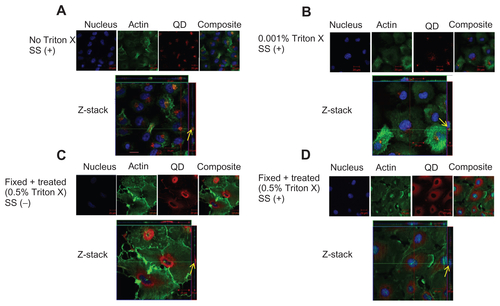
Figure S5 Localization of negatively charged 50 nm fluorescent SiO2-NP in HUVECs. HUVECs were exposed to SiO2-NP under various conditions. Z-stack (single slice) images show localization of NP under the following conditions. (A) Z-stack showing surface localization of SiO2-NP in untreated cells under shear stress conditions (0.05 Pa); (B) Z-stack showing surface localization of SiO2-NP in cells which were treated with 0.001% Triton X under flow conditions (0.05 Pa); (C) Z-stack showing absence of NP association in fixed/permeabilized cells under static conditions; (D) Z-stack showing intra-cytoplasmic localization of SiO2-NP in in fixed/permeabilized cells under shear stress conditions (0.05 Pa).
Notes: Images are representative of three independent experiments. Arrows: location of 50 nm silica NP.
Abbreviations: QD, quantum dot(s); NP, nanoparticle(s); HUVEC(s), human umbilical vein endothelial cell(s); EC, endothelial cell(s); SS, shear stress.