Figures & data
Table 1 Summarization of purification of alpha-momorcharin (α-MMC) and momordica anti-HIV protein (MAP30) from 200 g of bitter melon seeds
Figure 1 SDS-PAGE of extracts and eluates from different purification steps. Lane 1: crude extract; Lane 2: dialytic sample after AS precipitation; Lane 3: eluate from SP-Sepharose FF chromatography; Lane 4: eluate from gel filtration chromatography; Lane 5: α-MMC from Macro-Cap-SP chromatography; Lane 6: MAP30 from Macro-Cap-SP chromatography; Lane7: LMW calibration kit.
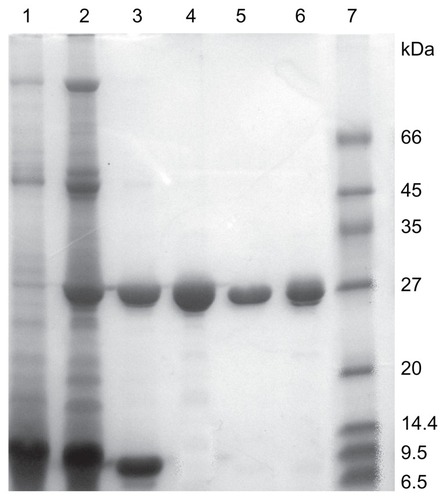
Figure 2 Western blot analysis of α-MMC and MAP30. (A) Lane 1: reduced SDS-PAGE of α-MMC; Lane 2: western blot profile of α-MMC. (B) Lane 1: reduced SDS-PAGE of MAP30; Lane 2: western blot profile of MAP30.
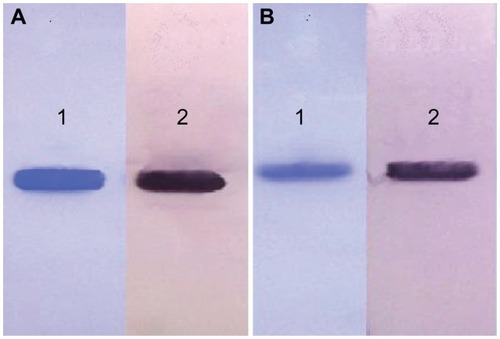
Figure 3 MALDI-TOF-MS analyses of both α-MMC and MAP30. (A) MALDI-TOF-MS profile of α-MMC. The average MW of α-MMC was 28551.6 Da (B) MALDI-TOF-MS profile of MAP30. The average MW of MAP30 was 29072.0 Da.
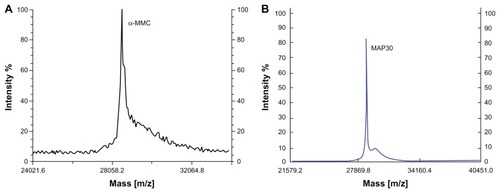
Figure 4 Gradient SDS-PAGE of both PEGylated α-MMC and PEGylated MAP30 conjugates. (A) Lane 1: α-MMC as a control; Lane 2: mixture of α-MMC and α-MMC-PEG conjugate; Lane 3: purified α-MMC-PEG conjugate; Lane 4: unmodified α-MMC; Lane 5: HMW calibration kit. (B) Lane 1: MAP30 as a control; Lane 2: mixture of MAP30 and MAP30-PEG conjugate; Lane 3: purified MAP30-PEG conjugate; Lane 4: unmodified MAP30; Lane 5: HMW calibration kit.
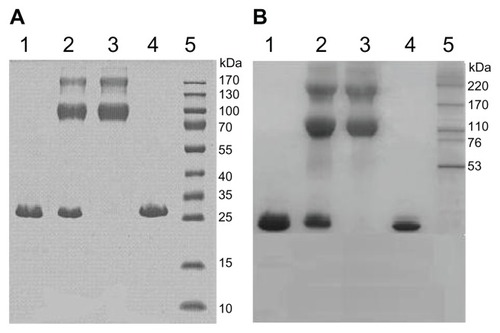
Figure 5 MALDI-TOF-MS analysis of both PEGylated α-MMC and PEGylated MAP30 conjugates. (A) The (mPEG)2-Lys-NHS was around 20 kDa and the PEG conjugates were observed at 49899.4 Da, 70430.9 Da and 91057.6 Da, reflecting 1, 2 or 3 PEG-bound chains per α-MMC molecule. (B) The (mPEG)2-Lys-NHS was around 20 kDa and the PEG conjugates were observed at 50335.6 Da and 70614.2 Da, reflecting 1 or 2 PEG-bound chains per MAP30 molecule.
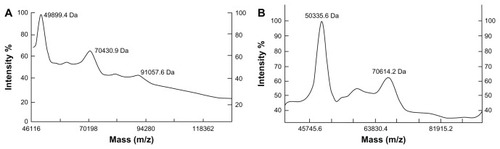
Figure 6 Topological inactivation activities. Lane 1: DNA marker; Lane 2: pUC18 DNA as a control; Lane 3 and 4: pUC18 DNA was incubated with α-MMC, PEG-α-MMC; Lane 5 and 6: pUC18 DNA was incubated with MAP30, PEG-MAP30.
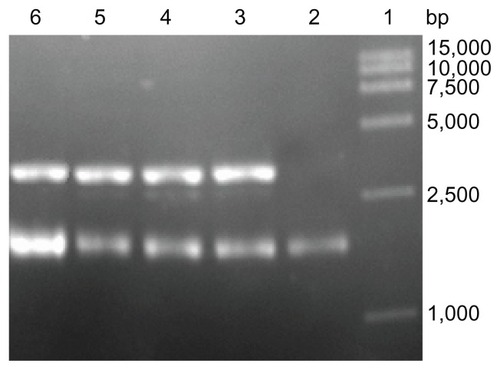
Figure 7 Inhibitory effects of α-MMC/MAP30 and PEG-α-MMC/MAP30 on the proliferation of human choriocarcinoma JAR cells. JAR cells were treated with increasing concentrations for 72 hours. (A) and for various time points at 1.5 mg/mL. (B) of native or PEGylated α-MMC/MAP30 as indicated.
Note: Each data point represents the average of three independent experiments performed in quadruplicate.
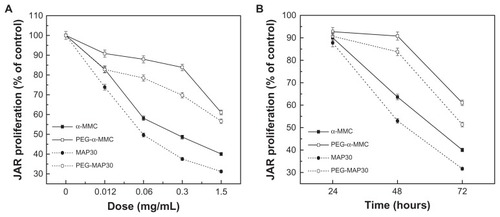
Figure 8 Morphological differences in JAR cells for 72 hours culture photographed by phase contrast microscopy. JAR cells treated without drugs (A), with 15 μg/mL 5-fluorouracil (B), with 0.3 (C) and 1.5 mg/mL α-MMC (D) and with 0.3 (E) and 1.5 mg/mL PEG-α-MMC. (F) The white bar presents 50 μm.
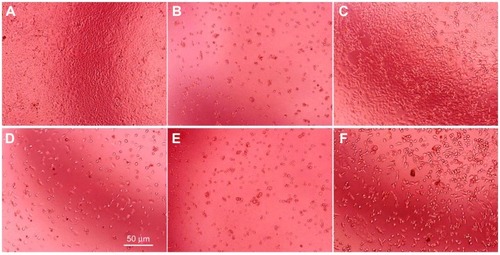
Table 2 Herpes simplex virus-1-induced cytopathic effect (CPE) of VERO cell (50% tissue culture infective dose (TCID50) = antilog [(55.6–50)/55.6–20) × (−1) + (lg10−5)] = 10−5.2/0.1 mL = 10−6.2/mL)
Table 3 Inhibitory effects of RIPs and PEGylated RIPs on herpes simplex virus-1 (HSV-1) antigen
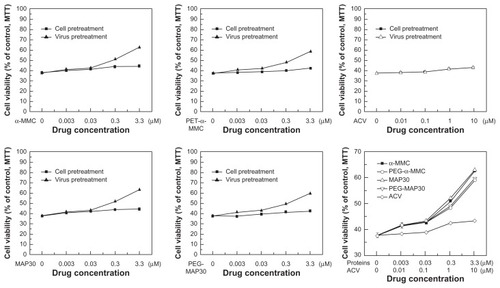
Figure 9 Different concentrations of proteins on cell viability of VERO cells.
Abbreviations: α-MMC, alpha-momorcharin; MAP30, momordica anti-HIV protein; PEG, polyethylene glycol; ACV, acyclovir.
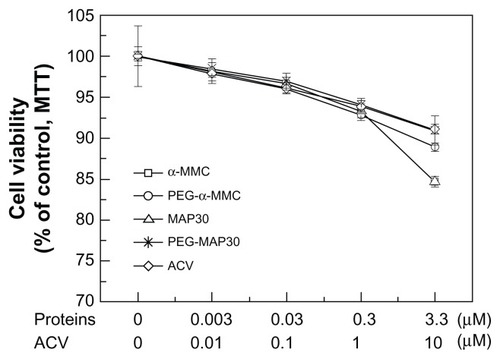
Figure 10 The ratio of cell viability under different concentration of proteins.