Figures & data
Table 1 Size and zeta-potential of activated and nonactivated EGF-dendriplexes
Figure 1 Formation and stability analysis of activated EGF-dendriplexes. (A) Agarose gel retardation assay of activated EGF-dendriplexes at different EGF/DNA weight ratio. Lane 1: 1 kb DNA ladder; lane 2: plasmid DNA; lane 3: nonactivated dendriplexes at charge ratio (N/P) of 20; lane 4: activated dendriplexes at charge ratio (N/P) of 20; Lane 5–7: activated EGF-dendriplexes at charge ratio (N/P) of 20 and EGF/DNA weight ratio of 0.2, 2, and 20 respectively. (B) DNA condensation assay of nonactivated dendriplexes, activated dendriplexes, and activated EGF-dendriplexes at EGF/DNA weight ratio of 0.2, 2, and 20. Mean ± standard deviation (n = 6) of relative viability is shown. (C) DNaseI digestion test of dendriplexes. Lane 1: 1 kb DNA ladder; lane 2: plasmid DNA without digestion; lane 3–8: DNA in different form post digestion and disassembly of complexes. Lane 3: free plasmid DNA; lane 4: DNA in nonactivated dendriplexes at charge ratio (N/P) of 20; lane 5: DNA in activated dendriplexes at charge ratio (N/P) of 20; Lane 6–8: DNA in activated EGF-dendriplexes at charge ratio (N/P) of 20 and EGF/DNA weight ratio of 0.2, 2, and 20, respectively.
Note: DNA indicates naked plasmid DNA; nonactivated indicates nonactivated dendriplexes.
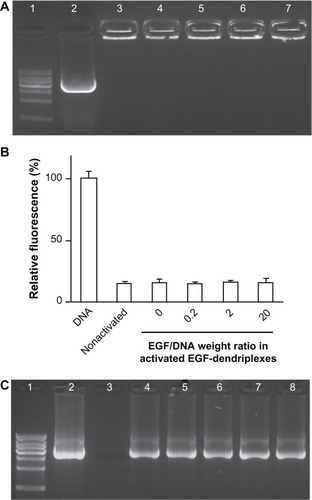
Figure 2 Expression of enhanced green fluorescent protein (EGFP) in MCF-7/EGFR cells transfected with pEGFP-N3. (A) Scanned through a fluorescence microscope; (B) tested by flow cytometry analysis.
Note: Mean ± standard deviation (n = 3) of transfection efficiency is shown.
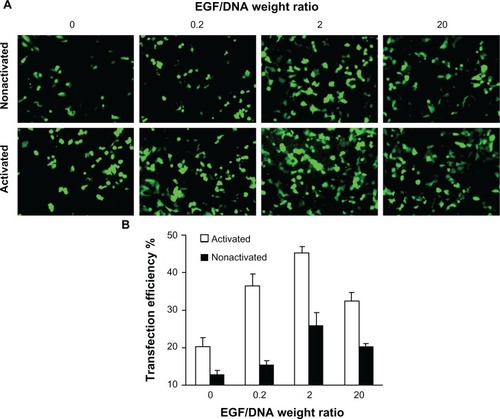
Figure 3 Expression of enhanced green fluorescent protein (EGFP) in different cell lines transfected with pEGFP-N3 scan through a fluorescence microscope. (A) EGFR-negative HEK 293T cells; (B) EGFR-positive human breast cancer MDA-MB-231 cells.
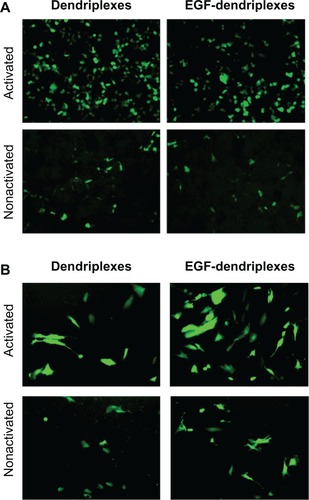
Figure 4 The viability of MCF-7/EGFR cells 4 hours after adding activated or nonactivated EGF-dendriplexes (N/P = 20) with different weight ratio of EGF/DNA.
Note: Mean ± standard deviation (n = 6) of relative viability is shown. Viability is calculated from average OD 570-fold change relative to control culture.
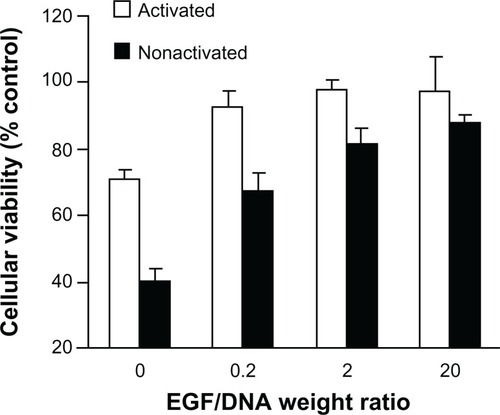
Figure 5 The viability of MCF-7/EGFR cells administrated with EGF-dendriplexes or equivalent amount of free EGF.
Notes: Viability is tested immediately after 4 hours of transfection, and 3 days under incubation after transfection termination. Relative viability to control cells is shown. Mean ± standard deviation (n = 6) of relative viability is shown.
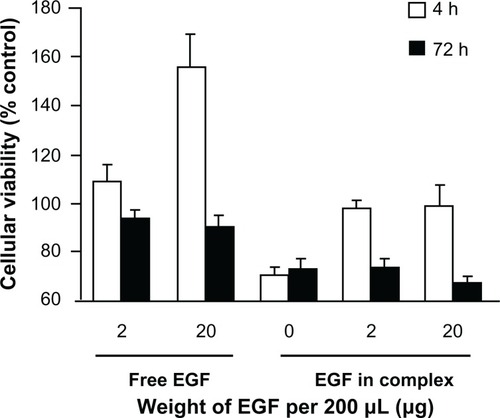
Figure 6 X-ray, in vivo NIR fluorescence and bioluminescence overlay images of tumor-bearing mice 2 hours after being treated with activated dendriplexes and activated EGF-dendriplexes.
Notes: The location of MDA-MB-231-luc tumor was determined with bioluminescence by injecting 150 mg/kg D-luciferin. The optical imaging was obtained using Kodak multimodal imaging system FX-Pro equipped with an excitation bandpass filter at 690 nm and an emission at 790 nm. The calibration bar shows the fold increase in fluorescence counts from the minimum fluorescence counts EGF-modified indicates activated EGF-dendriplexes; nonmodified indicates activated dendriplexes.
Abbreviations: NIR, near-infrared fluorescence.
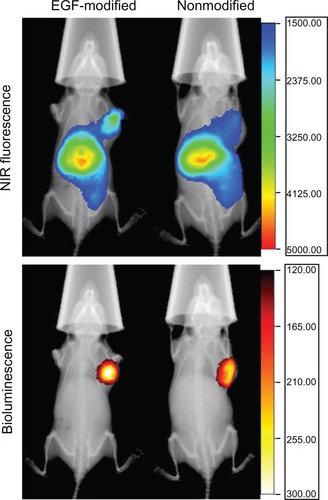
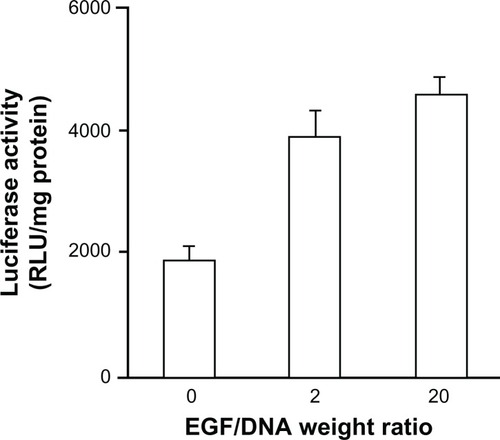
Figure 7 In vivo gene expression in MCF-7/EGFR tumor tissues 24 hours post-intravenous injection of nonmodified activated dendriplexes and activated EGF-dendriplexes at EGF/DNA weight ratio of 2 and 20.
Note: Mean ± standard deviation (n = 3) of Renilla luciferase activity is shown.