Figures & data
Figure 1 Schwann cells (SCs) and neural stem cells (NSCs) culture and identification. (A) SCs (arrow) were viewed under light microscopy; (B) Cell bodies (arrow) were stained with antibodies against S100 and nuclei were labeled by DAPI; (C) Neurospheres were stained with antibodies against nestin, a marker of NSCs; (D) Nuclei in the neurosphere were labeled by DAPI. Scale bar = 20 μm in (A–B) and 10 μm in (C–D); (E) SEM of a transverse section of PLGA scaffold shows one of the tubes (arrow). There are numerous pores with variable diameters between tubes; (F) A longitudinal section of PLGA was imaged under high SEM.
Note: The arrow points to the radial channel that extends from the scaffold tube.
Abbreviations: DAPI, 4′,6-diamidino-2-phenylindole; SEM, scanning electron microscope; PLGA, poly-(lactic acid-co-glycolic acid).
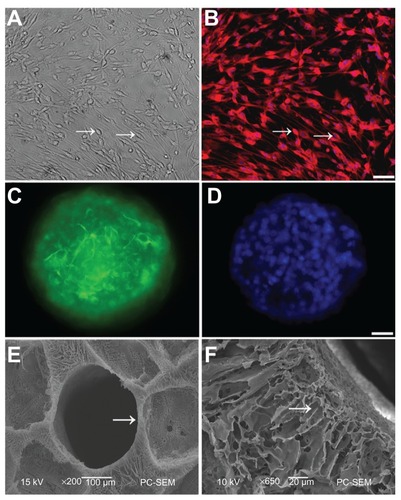
Figure 2 Secretion of NT-3 from NT-3-PLGA carriers loaded with three different SF solutions groups for at least 4 weeks. Daily release of NT-3 was examined by ELISA in (A) the 3% SF solution group; (B) the 1% SF solution group; (C) the 6% SF solution group, respectively; and (D) There was cumulative release of NT-3 across the three different groups after at least 4 weeks.
Note: Error bars represent mean ± SD (n = 3 for each group).
Abbreviations: NT-3, neurotrophin-3; PLGA, poly-(lactic acid-co-glycolic acid); SF, silk fibroin; ELISA, enzyme-linked immunosorbent assay.
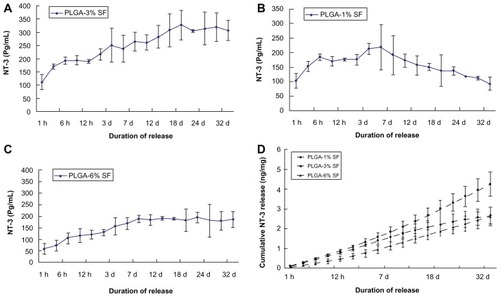
Figure 3 Survival of cultured cells in the scaffold. NSCs and SCs were cultured in the NT-3-PLGA carriers for 14 days, and stained with calcein-AM and EthD-1. Viable cells were labeled green and dead cells were marked by red fluorescence. The arrows point to dead cells in (A) PLGA only; (B) PLGA-SF; and (C) the PLGA-SF-NT-3 group. The stars mark living cells; (D) Percentage of dead cells in the periphery and center of PLGA slices.
Note: Scale bar = 20 μm in A–C.
Abbreviations: NSCs, neural stem cells; SCs, Schwann cells; EthD, ethidium homodimer; NT-3, neurotrophin-3; PLGA, poly-(lactic acid-co-glycolic acid); SF, silk fibroin.
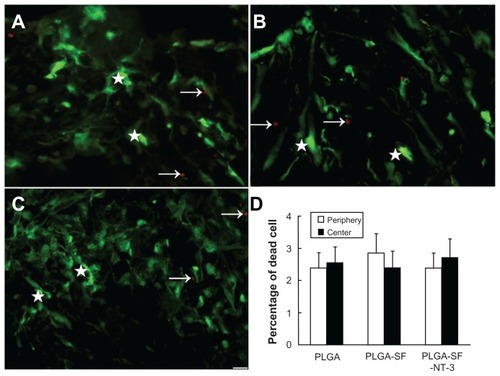
Table 1 Comparison of cell-types (mean ± SD %) among different groups
Figure 4 Differentiation detection of grafted NSCs. Cells were immunostained with markers for neurons in PLGA only. (A) PLGA-SF; (B) PLGA-SF-NT-3; (C) group (Map2; arrows in (A–C) green), astrocytes (GFAP; stars in A–C = red). The nuclei were labeled by DAPI (=blue); (D) Compared with other groups, cells expressing Map2 in the PLGA-SF-NT-3 group were significantly higher than any other groups (P < 0.05; n = 3 for each group). Cells positive for GFAP were much less. By contrast, astrocytes were abundant in both the PLGA and PLGA-SF groups. Scale bar = 20 μm in (A–C). Cells collected from the slices were lysed, and proteins were extracted for Western blotting analysis; (E) Levels of TuJ-1 expression appeared higher in the PLGA-SF-NT-3 group than those in the PLGA, or PLGA-SF groups. Proteins extracted from the rat brain were used as a positive control (brain); (F) Quantification of TuJ-1 blot normalized against GAPDH. (P < 0.05; n = 3 for each group); (G) Western blotting against GFAP; (H) Quantitative analysis showed that the level of GFAP in the PLGA-SF-NT-3 was lower than that of any other groups (P < 0.05; n = 3 for each group). Stars in (D), (F), and (H) indicate P < 0.05 when PLGA-SF-NT-3 versus PLGA or PLGA-SF.
Abbreviations: NSCs, neural stem cells; PLGA, poly-(lactic acid-co-glycolic acid); SF, silk fibroin; NT-3, neurotrophin-3; Map2, microtubule-associated protein 2; GFAP, glial fibrillary acidic protein; DAPI, 4′,6-diamidino-2-phenylindole; TuJ-1, neuron-specific class III beta-tubulin; GAPDH, Glyceraldehyde 3-phosphate dehydrogenase.
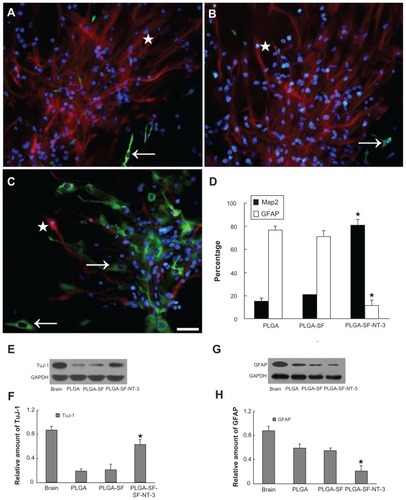
Figure 5 Synaptic formation of culture cells in the NT-3-PLGA carriers. Cells were immunostained with antibodies against pre- and postsynaptic markers (PSD95 versus synapsin). Nuclei were labeled by DAPI (blue). (A) Only a few cells expressed synapsin (stars in A–C = green) and PSD95 (arrows in A–C = red) in the PLGA group. PSD95 was localized in the cell body; whereas synapsin was expressed in both the cell body and neurite; (B) Synapsin- or PSD95-positive cells were sparse in the PLGA-SF group; (C) In the PLGA-SF-NT3 group, the cells expressed (1) cells positive for either PSD95 or synapsin; (2) cells positive for both PSD95 and synapsin; (3) cells with positive PSD95-staining in the body, but receiving synapsin-positive neurites extending from another cell; (D) Cells with staining of PSD95 and synapsin were manually counted. Compared with other groups, positively stained cells (Synapsin+ or PSD95+) in the PLGA-SF-NT3 group were significantly higher than any other groups (P < 0.05; the star in D indicates P < 0.05 when PLGA-SF-NT-3 versus PLGA or PLGA-SF); (E) Under transmission electron microscopy (TEM), a neuron was identified in PLGA-SF-NT-3 group. Note the neurite extending from the soma of one cell and connecting to a neutrite of another cell. (F) High magnification TEM of synapse formation in cultured cells, revealing specialized high-density pre- and postsynaptic membrane, synaptic cleft, and vesicles in its terminal.
Note: Scale bar = 20 μm in A–C, 200 nm in F.
Abbreviations: NT-3, neurotrophin-3; PLGA, poly-(lactic acid-co-glycolic acid); PSD95, postsynaptic density-95; DAPI, 4′,6-diamidino-2-phenylindole; SF, silk fibroin.
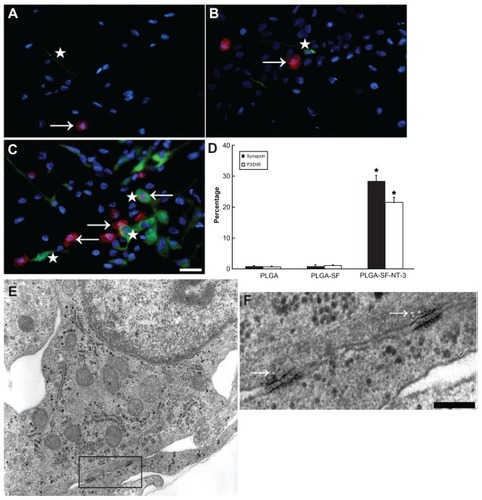
Figure 6 Release of synaptic vesicles during depolarization by high [K+]. (A) In the PLGA-SF-NT-3 group, FM1-43 fluorescent puncta were particularly concentrated at sites where neurites crossed over (see arrows) under stimulation of high [K+] (50 mM); (B) After 3-minute stimulation by the high [K+], fluorescence intensity of these puncta was weakened or disappeared; (C) By contrast, uptake of the fluorescent signal into the cells in the NSCs group was only minimal, and showed weak fluorescence prior to three-minute stimulation; (D) Fluorescence intensity remained unchanged after the stimulation period; (E) FM4-64 fluorescent puncta before; and (F) after stimulation of high [K+]; (G). FM1-43 fluorescence was tracked on the cells in the PLGA-SF-NT-3 group, which was continuously depolarized for 5 minutes. Recording from the cytoplasm was used as a control, and showed no significant change over the 5-minute period (arrow in G).
Abbreviations: PLGA, poly-(lactic acid-co-glycolic acid); SF, silk fibroin; NT-3, neurotrophin-3; NSCs, neural stem cells; FM1-43, [(N-3-triethylammonmpropyl)-4- (4-(dibutylamino)styryl)]; FM4-64, [N-(3-triethylammoniumpropyl)-4-(6-(4-(diethylamino)phenyl) hexatrienyl)pyridiniumdibromide].
![Figure 6 Release of synaptic vesicles during depolarization by high [K+]. (A) In the PLGA-SF-NT-3 group, FM1-43 fluorescent puncta were particularly concentrated at sites where neurites crossed over (see arrows) under stimulation of high [K+] (50 mM); (B) After 3-minute stimulation by the high [K+], fluorescence intensity of these puncta was weakened or disappeared; (C) By contrast, uptake of the fluorescent signal into the cells in the NSCs group was only minimal, and showed weak fluorescence prior to three-minute stimulation; (D) Fluorescence intensity remained unchanged after the stimulation period; (E) FM4-64 fluorescent puncta before; and (F) after stimulation of high [K+]; (G). FM1-43 fluorescence was tracked on the cells in the PLGA-SF-NT-3 group, which was continuously depolarized for 5 minutes. Recording from the cytoplasm was used as a control, and showed no significant change over the 5-minute period (arrow in G).Abbreviations: PLGA, poly-(lactic acid-co-glycolic acid); SF, silk fibroin; NT-3, neurotrophin-3; NSCs, neural stem cells; FM1-43, [(N-3-triethylammonmpropyl)-4- (4-(dibutylamino)styryl)]; FM4-64, [N-(3-triethylammoniumpropyl)-4-(6-(4-(diethylamino)phenyl) hexatrienyl)pyridiniumdibromide].](/cms/asset/1b2ecc7d-48e3-41d3-9a36-2206d84d6f62/dijn_a_30706_f0006_c.jpg)
Figure 7 Formation of myelin sheath in the coculture system. NSCs and SCs in the cells/PLGA were cultured for 14 days, and immunostained with antibodies against neuron and myelin sheath markers (Map2 = red versus MBP = green). Nuclei were labeled by DAPI (blue). (A) Arrow indicates segments of neuronal axons wrapped by (MBP-positive) myelin sheath in PLGA; (B) the PLGA-SF group; and (C) PLGA-SF-NT-3 group, respectively; (D) Abundance of MBP-positive fibers in the PLGA-SF-NT-3 group compared with other groups (P < 0.05; n = 3 for each group); (E) TEM showing formation of the myelin sheath in the PLGA-SF-NT-3 group; (F) Typical, characteristic sheath composed of several layers wrapped around axons.
Note: Scale bar = 20 μm in (A–C), 200 nm in (F).
Abbreviations: NSCs, neural stem cells; SCs, Schwann cells; PLGA, poly-(lactic acid-co-glycolic acid); SF, silk fibroin; NT-3, neurotrophin-3; Map2, microtubule-associated protein 2; MBP, myelin basic protein; TEM, transmission electron microscopy.
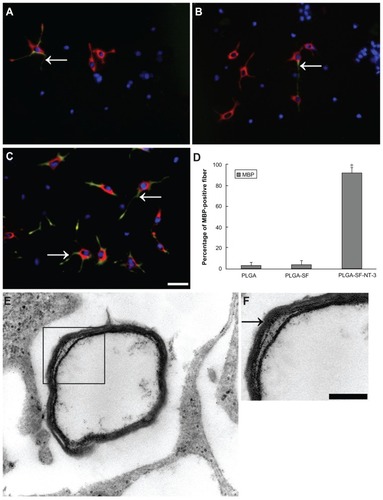
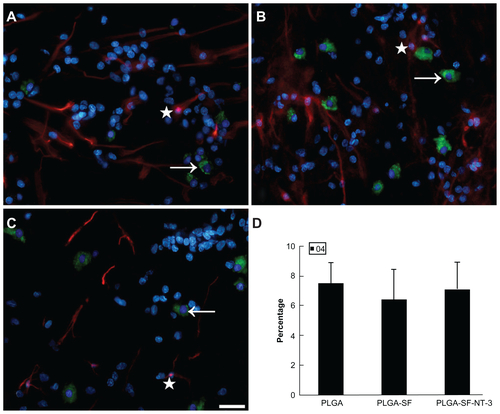
Figure S1 NSCs and SCs were cultured in the scaffold for 14 days. Cells were immunostained in (A) PLGA only; (B) PLGA-SF; (C) PLGA-SF-NT-3 group with markers for astrocytes (GFAP; star; red), and oligodendrocytes (O4; arrow; green). Nuclei were stained by DAPI (blue); (D) Cells with staining of O4 were manually counted. There was no statistical difference among groups (P > 0.05; n = 3 for each group).
Note: Scale bar = 20 μm in A–C.
Abbreviations: NSCs, neural stem cells; SCs, Schwann cells; PLGA, poly-(lactic acid-co-glycolic acid); SF, silk fibroin; NT-3, neurotrophin-3; GFAP, glial fibrillary acidic protein; DAPI, 4′,6-diamidino-2-phenylindole.