Figures & data
Figure 1 Powder X-ray diffraction patterns of (A) zinc oxide, (B) CETN, and (C) cetirizine.
Abbreviation: CETN, cetirizine nanocomposite.
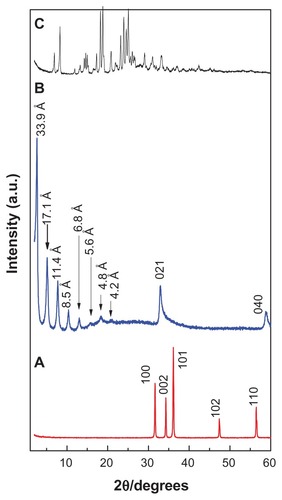
Figure 2 Structure of cetirizine at different pH (A–C) and molecular structure model of cetirizine intercalated between the interlayer of ZLH (D).
Abbreviation: ZLH, zinc-layered hydroxide.
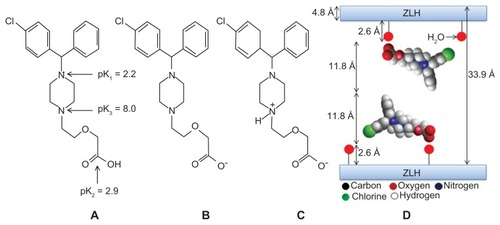
Table 1 Fourier transform infrared assignment for cetirizine and CETNCitation21,Citation29
Figure 3 Fourier transform infrared spectra of (A) cetirizine and (B) the cetirizine nanocomposite.
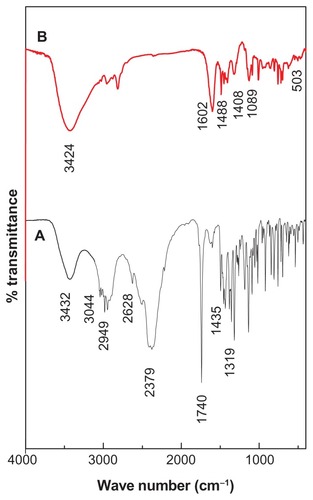
Figure 4 Thermogravimetric and differential thermogravimetric analyses of (A) cetirizine and (B) the cetirizine nanocomposite.
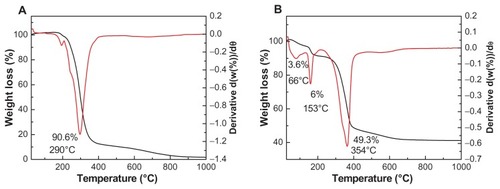
Table 2 Physico-chemical properties of zinc oxide and the cetirizine nanocomposite (CETN)
Figure 5 Adsorption-desorption isotherms for zinc oxide and CETN (A) and Barret–Joyner–Halenda method pore size distribution for zinc oxide and CETN (B).
Abbreviation: CETN, cetirizine nanocomposite.
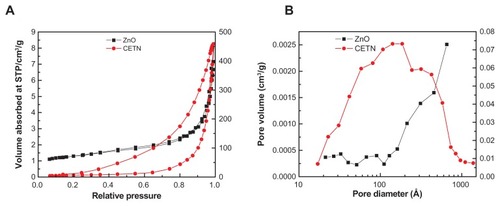
Figure 6 Field emission scanning electron microscope image of zinc oxide (A and B) and the cetirizine nanocomposite (C and D).
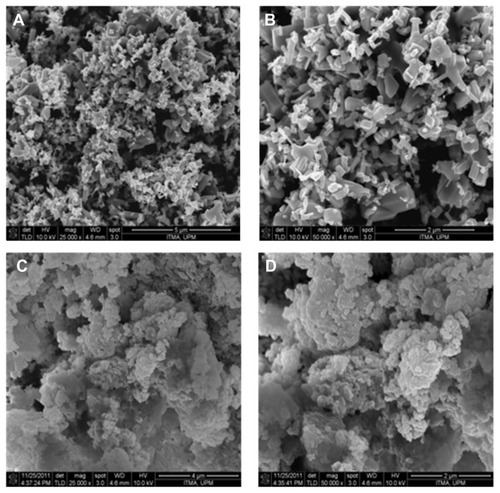
Figure 7 (I) Release profiles of cetirizine from the cetirizine nanocomposite at pH 7.4 (A) and pH 4.8 (B) up to 5 hours; (II) release profiles of cetirizine up to 83 hours.
Note: Inset shows the release profiles of cetirizine from its physical mixture of cetirizine with zinc layered hydroxide at pH 7.4 (C) and pH 4.8 (D).
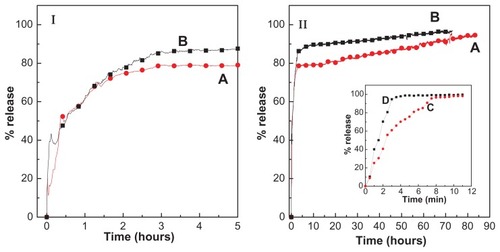
Table 3 Correlation coefficient (R2), rate constant (k), and half time (t1/2) obtained by fitting the data of the release of cetirizine from the cetirizine nanocomposite (CETN) into phosphate buffer solution at pH 7.4 and pH 4.8
Figure 8 Fitting of the data of cetirizine released from the cetirizine nanocomposite into various solutions to the first-, pseudo-second order kinetics and parabolic diffusion model for pH 7.4 (A–C) and pH 4.8 (D–F).
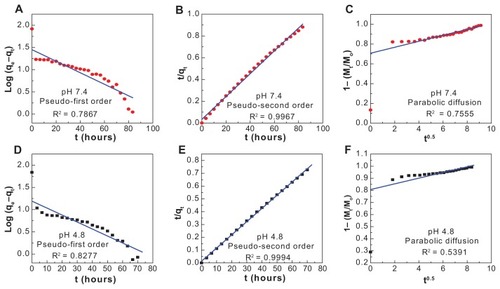
Table 4 Viability of normal Chang liver cells after 24 hours’ treatment with zinc-layered hydroxide (ZLH) and cetirizine nanocomposite (CETN)
Figure 9 Trypan Blue assays of normal Chang liver cells after 24 hours of treatment with zinc-layered hydroxide (ZLH) and cetirizine nanocomposite (CETN).
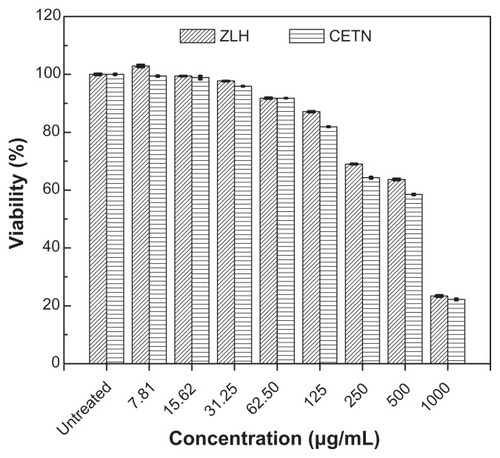
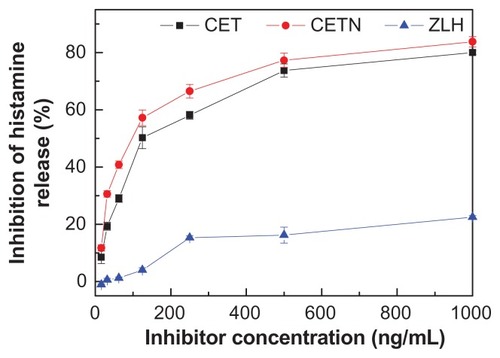
Table 5 Inhibition percentage of histamine release in rat basophilic leukemia cells by free cetirizine, the cetirizine nanocomposite (CETN), zinc-layered hydroxide (ZLH), and cetirizine intercalated into CETN
Figure 10A–C Histamine release response of rat basophilic leukemia cells treated at different concentrations of cetirizine, cetirizine nanocomposite, and zinc-layered hydroxide.
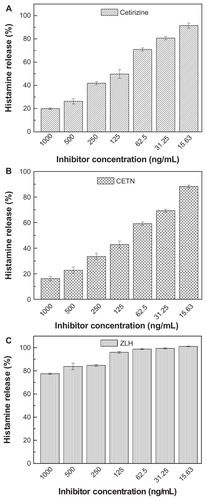
Figure 11 Percentage inhibition of histamine release into rat basophilic leukemia cells at different concentrations of cetirizine (CET), cetirizine nanocomposite (CETN), and zinc-layered hydroxide (ZLH).