Figures & data
Figure 1 Schematic representation and measurement principle of the CDs/GO electrochemical biosensors.Abbreviations: CDs, carbon dots; MB, methylene blue; GO, graphene oxide; GCE, glassy carbon electrode.
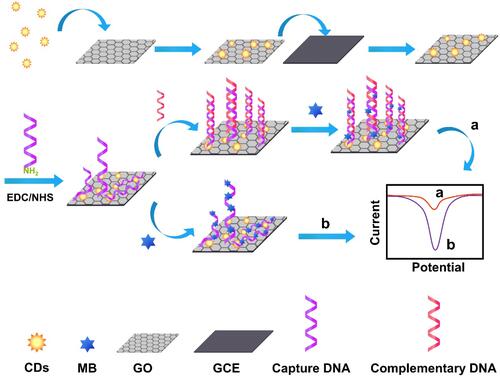
Figure 2 TEM (A) and HRTEM (C) images of the CDs; (B) Size distribution of the CDs; (D) Fluorescence spectra and UV/Vis absorption spectra of the CDs, inset in : HRTEM image of the single CDs, inset in : the photographs of the aqueous solution of the CDs (left) under UV light (365nm) and the CDs (right) under daylight lamp.
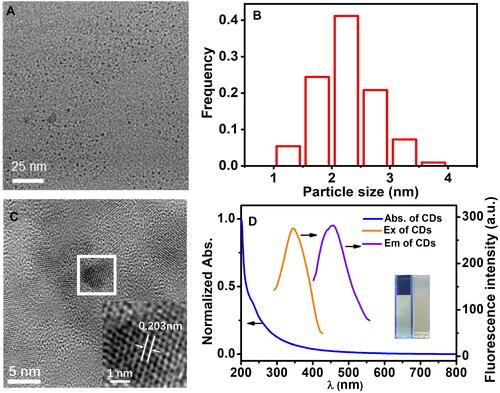
Figure 3 SEM images of the GO (A) and CDs/GO nanocomposites (B); TEM images of the GO (C) and CDs/GO nanocomposites (D).
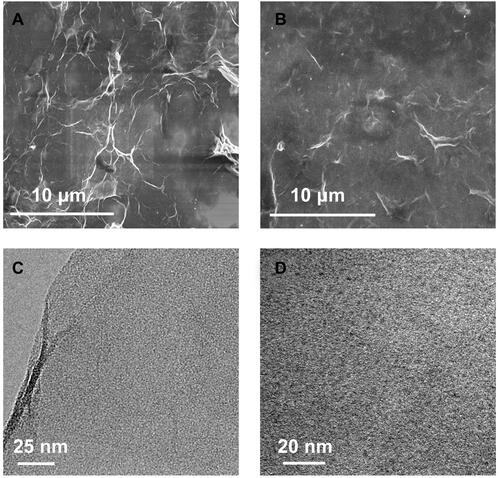
Figure 4 CV (A) and EIS (B) of CDs/GO nanocomposites modified GCE with different weight ratio of CDs to GO, including GO (a), 1:50 (b), 1:30 (c), 1:10 (d), 1:5 (e), 1:3 (f). Inset of : anodic peak current with different weight ratio of CDs/GO nanocomposites modified GCE. Inset of : the enlarged EIS of curve d, e and f. The above-mentioned electrochemical characteristics of the modified electrodes measured in PBS (10 mM, pH 7.4) containing 10 mM [Fe(CN)6]3,/4 − and 0.1 M KCl.
![Figure 4 CV (A) and EIS (B) of CDs/GO nanocomposites modified GCE with different weight ratio of CDs to GO, including GO (a), 1:50 (b), 1:30 (c), 1:10 (d), 1:5 (e), 1:3 (f). Inset of Figure 4A: anodic peak current with different weight ratio of CDs/GO nanocomposites modified GCE. Inset of Figure 4B: the enlarged EIS of curve d, e and f. The above-mentioned electrochemical characteristics of the modified electrodes measured in PBS (10 mM, pH 7.4) containing 10 mM [Fe(CN)6]3,/4 − and 0.1 M KCl.](/cms/asset/b87d6913-7247-41f2-adc6-65d4eeed645f/dijn_a_308258_f0004_c.jpg)
Figure 5 DPV curve of the different materials modified electrodes in a solution of 10 mM PBS (pH 7.4) containing 1 mM MB: ssDNA/GO/GCE (a), dsDNA/GO/GCE (b), ssDNA/CDs/GCE (c), dsDNA/CDs/GCE (d), ssDNA/CDs/GO/GCE (e) and dsDNA/CDs/GO/GCE (f).
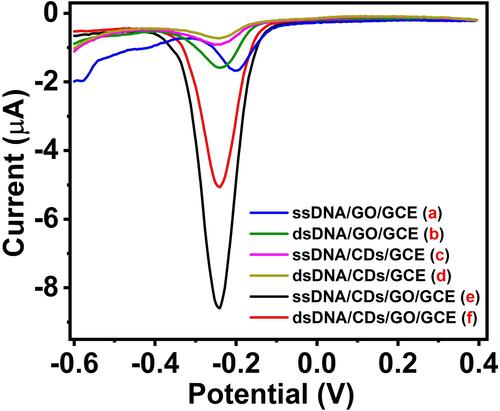
Figure 6 Optimization of experimental conditions: MB accumulation time (A), DNA hybridization time (B) and hybridization temperature (C). Specificity of the biosensor different target DNA (D): complementation target DNA (a); single-mismatched target DNA (b); mismatched target DNA (c); blank (d). Insert in : the difference of current signals (ΔI) of complementary target DNA (1), one base-mismatch target DNA (2) and non-complementary target DNA (3). ΔI= I-I blank.
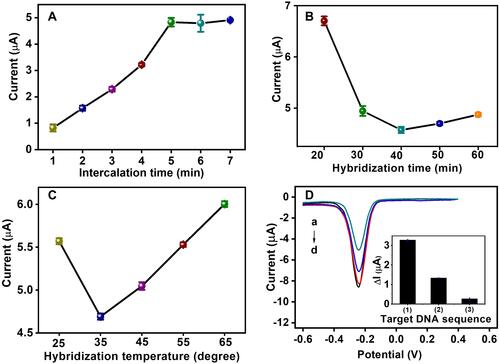
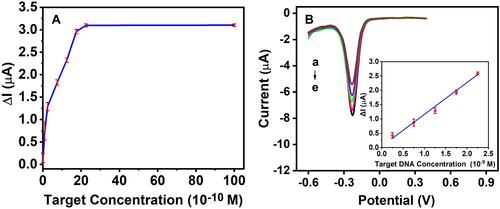
Figure 7 (A) The linear relationship between the different concentration of DNA target and ΔI. (B) DPV curves after hybridization with different target concentration (×10−9 M: (a) 2.25, (b) 1.75, (c) 1.25, (d) 0.75, (e) 0.25. Insert in shows that the linear relationship between the logarithmic of different concentration of DNA target and ΔI.