Figures & data
Table 1 Sequence of listing primers
Table 2 Clinical parameters in mice with dietary fiber supplementation
Figure 1 Effects of dietary fiber on hepatic lipid content in mice fed a HFD. Triglyceride and cholesterol levels in liver were measured after lipid extraction as described in the methods. (A) shows liver triglyceride concentration and (B) shows liver cholesterol levels. The results were normalized by protein concentrations.
Notes: Mean ± standard error of the mean (n = 9/group). *P < 0.05, SCF-supplemented group vs HFD-only group; #P < 0.05, SCF vs CEL.
Abbreviations: CEL, cellulose; HFD, high-fat diet; PSY, psyllium; SCF, sugar cane fiber.
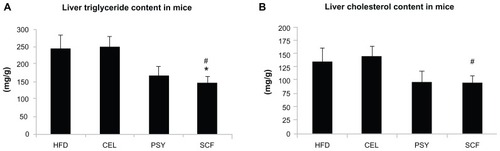
Figure 2 Hepatic fibroblast growth factor (FGF) 21 signaling in mice treated with dietary fiber. (A) FGF21 content of liver lysates, as measured by Rat/Mouse Fibroblast Growth Factor 21 (FGF21) ELISA Kit from Millipore (Billerica, MA). Hepatic FGF21 proteins were measured by western blotting. Liver lysates were subjected to sodium dodecyl sulfate polyacrylamide gel electrophoresis, then transferred into nitrocellulose membranes. βKlotho, fibroblast growth factor receptor (FGFR) 1, FGFR3, peroxisome proliferator-activated receptor alpha (PPARα), and peroxisome proliferator-activated receptor γ coactivator protein 1 alpha (PGC-1α) were determined using their corresponding specific antibodies, shown in (B). Results were normalized with β-actin.
Notes: Mean ± standard error of the mean (n = 9/group). *P < 0.05; **P < 0.01; ***P < 0.001, dietary fiber group vs HFD group; #P < 0.05; ##P < 0.01, CEL or PSY vs SCF group.
Abbreviations: CEL, cellulose; HFD, high-fat diet; PSY, psyllium; SCF, sugar cane fiber.
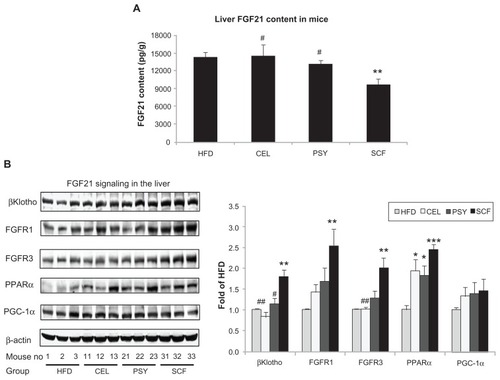
Figure 3 Gene expression of fibroblast growth factor (FGF) 21 signaling pathway in the liver and correlation between the gene levels. Hepatic FGF21 signaling-related gene expression was analyzed by real-time polymerase chain reaction assay. (A) FGF21 and its related gene expression levels; (B–G) show the correlations among genes.
Notes: Mean ± standard error of the mean (n = 9/group). *P < 0.05; **P < 0.01; ***P < 0.001, dietary fiber-supplemented group vs HFD-only group; #P < 0.05, CEL or PSY vs SCF group.
Abbreviations: AU, arbitrary unit; CEL, cellulose; HFD, high-fat diet; PPARα, peroxisome proliferator-activated receptor alpha; PGC-1α, peroxisome proliferator-activated receptor γ coactivator protein 1 alpha; PSY, psyllium; SCF, sugar cane fiber.
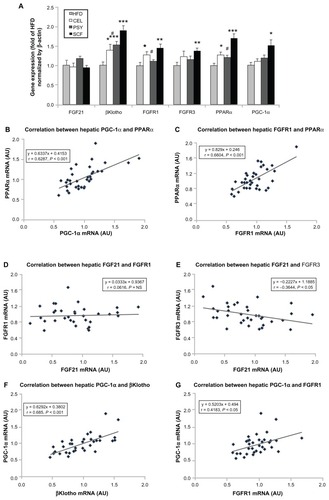
Figure 4 Effects of dietary fibers on insulin signaling protein abundance and phosphatidylinositol 3 kinase (PI 3K) activity in mice livers. Liver lysates were subjected to sodium dodecyl sulfate polyacrylamide gel electrophoresis and insulin signaling pathway proteins were detected with corresponding specific antibodies as shown in the figures. (A) shows that phosphorylation of antiphosphotyrosine 20 (PY 20), insulin receptor substrate (IRS) 1, insulin receptor beta (IR β), and Akt1 were normalized by their corresponding protein contents and PY 20 was normalized by β-actin. (B) Hepatic IRS-1-associated PI 3K activity in mice. Liver lysates from basal and insulin-stimulated mice were immunoprecipitated with IRS-1 antibody and protein A agarose. The immune complexes were incubated with reaction buffer containing [γ-32P]adenosine 5′-triphosphate, MgCl2, MnCl2, and phosphatidylinositol for 20 minutes. Autoradiograph was performed after thin-layer chromatography.
Notes: Data presented as mean ± standard error of the mean (n = 9/group). *P < 0.05; **P < 0.01; ***P < 0.001, dietary fiber-supplemented group vs HFD-only group; #P < 0.05; ##P < 0.01; ###P < 0.001; CEL or PSY vs SCF group.
Abbreviations: CEL, cellulose; HFD, high-fat diet; PSY, psyllium; SCF, sugar cane fiber.
![Figure 4 Effects of dietary fibers on insulin signaling protein abundance and phosphatidylinositol 3 kinase (PI 3K) activity in mice livers. Liver lysates were subjected to sodium dodecyl sulfate polyacrylamide gel electrophoresis and insulin signaling pathway proteins were detected with corresponding specific antibodies as shown in the figures. (A) shows that phosphorylation of antiphosphotyrosine 20 (PY 20), insulin receptor substrate (IRS) 1, insulin receptor beta (IR β), and Akt1 were normalized by their corresponding protein contents and PY 20 was normalized by β-actin. (B) Hepatic IRS-1-associated PI 3K activity in mice. Liver lysates from basal and insulin-stimulated mice were immunoprecipitated with IRS-1 antibody and protein A agarose. The immune complexes were incubated with reaction buffer containing [γ-32P]adenosine 5′-triphosphate, MgCl2, MnCl2, and phosphatidylinositol for 20 minutes. Autoradiograph was performed after thin-layer chromatography.Notes: Data presented as mean ± standard error of the mean (n = 9/group). *P < 0.05; **P < 0.01; ***P < 0.001, dietary fiber-supplemented group vs HFD-only group; #P < 0.05; ##P < 0.01; ###P < 0.001; CEL or PSY vs SCF group.Abbreviations: CEL, cellulose; HFD, high-fat diet; PSY, psyllium; SCF, sugar cane fiber.](/cms/asset/74db24e1-6278-44f0-bfd4-efdc5843401a/dijn_a_30887_f0004_b.jpg)
Figure 5 Effects of dietary fibers on liver AMP-activated protein kinase (AMPK) signaling in mice. The protein abundances of AMPKα1, AMPKα2, ACC, SIRT1, sterol regulatory element-binding protein (SREBP) 1c and phosphorylated AMPKα, and ACC were measured by immunoblotting.
Notes: Data are shown as mean ± standard error of the mean (n = 9/group). *P < 0.05; **P < 0.01; ***P < 0.001, dietary fiber-supplemented group vs HFD-only group; ##P < 0.01, CEL or PSY vs SCF group.
Abbreviations: CEL, cellulose; HFD, high-fat diet; PSY, psyllium; SCF, sugar cane fiber.
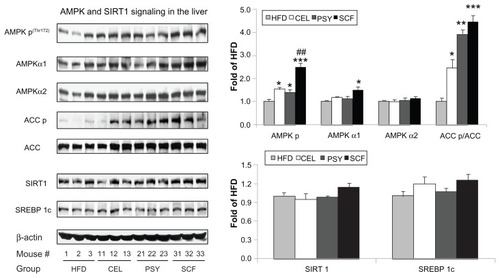
Figure S1 Sugar cane fiber processing conditions.
Notes: After blending, a proprietary method was used to reduce the remaining components (bagasse) to nanometer-sized particles. The particle sizes of sugarcane fiber were: blended > condition 15 > condition 30 > condition 45 > condition 60, in which 70% of particles were less than 1 μm.
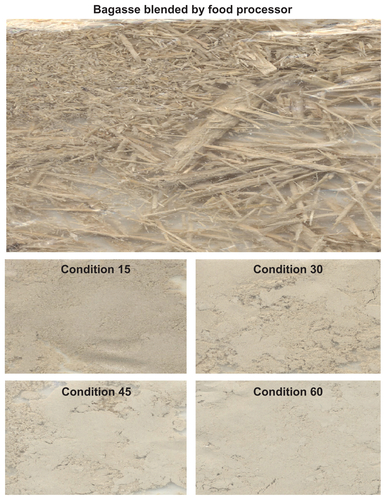
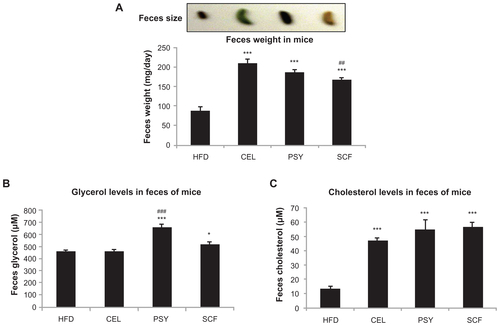
Figure S2 Feces weight and lipid contents in mice fed various dietary fibers. (A) Feces size and weight. The different colors are due to food dye. Feces were collected over a 24-hour period and weighed. (B) and (C) show the glycerol and cholesterol content of mouse feces. Lipids were extracted from feces using chloroform:methanol (1:2, v/v). Glycerol and cholesterol levels in the feces were determined using using a free glycerol determination kit, cat # FG0100 (Sidma-Aldrich, St Louis, MO) or a cholesterol quantitation kit, cat # K603-100 (BioVision, Milpitas, CA), respectively.
Notes: Data are shown as mean ± standard error of the mean (n = 9/group). *P < 0.05; ***P < 0.001, dietary fiber groups vs unsupplemented high-fat diet group. ##P < 0.05; ###P < 0.001, comparison between dietary groups.
Abbreviations: CEL, cellulose; HFD, high-fat diet; PSY, psyllium; SCF, sugar cane fiber.