Figures & data
Figure 1 Schematic apparatus used for transfection experiment in the presence of ultrasound.
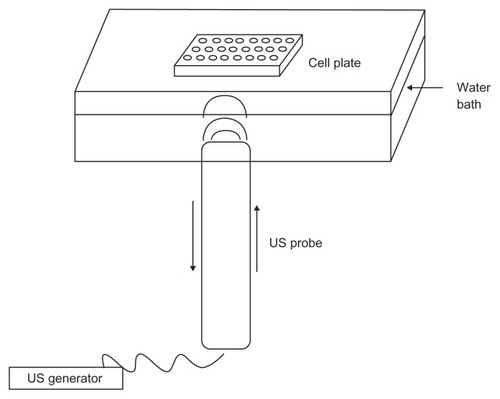
Table 1 Physicochemical characteristics of chitosan nanobubbles
Figure 2 Transmission electron microscopy image of (A) unloaded and (B) DNA-loaded chitosan nanobubbles.
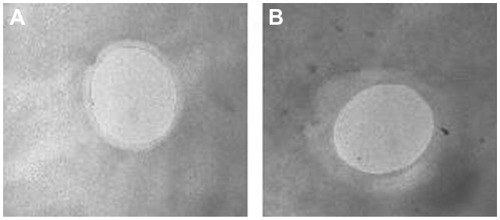
Figure 3 Differential scanning calorimetry profile of chitosan solution and chitosan nanobubbles.
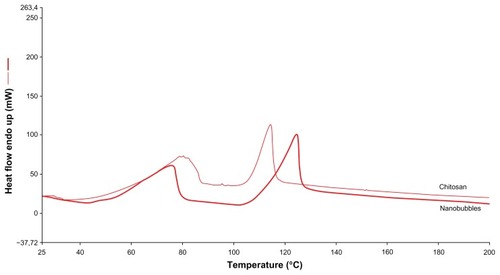
Figure 4 Electrophoresis of DNA-loaded chitosan nanobubbles on agarose gel.
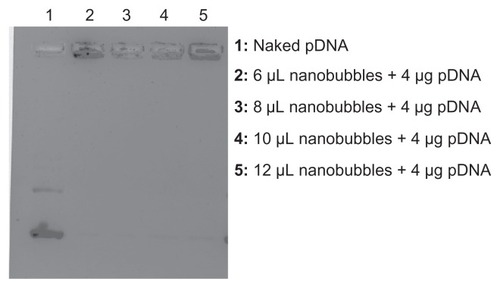
Figure 5 In vitro pDNA release from DNA-loaded chitosan nanobubbles after exposure to ultrasound.
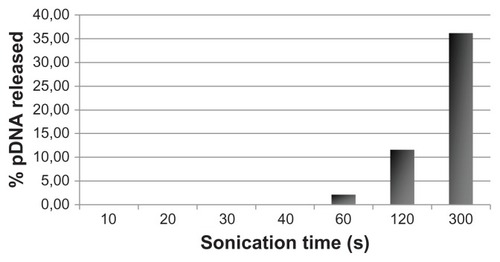
Figure 6 (A) COS7 cells exposed to 30 seconds of insonation in presence of pDNA-loaded nanobubbles carrying 10 μg/mL of pDNA and examined 24 hours post transfection by confocal laser scanning microscopy without fixation. (B) COS7 cells treated as in (A) but not sonified. (C) COS7 cells neither exposed to ultrasound nor to DNA-loaded nanobubbles.
Note: The upper panels show fluorescence images while the lower panels show merged phase-contrast and fluorescence images.
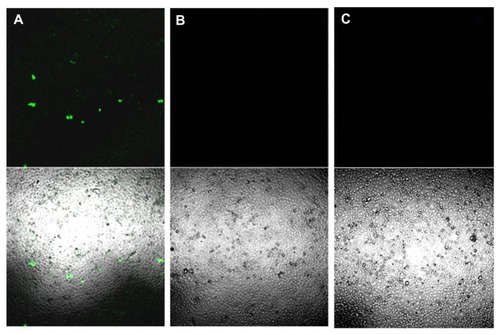
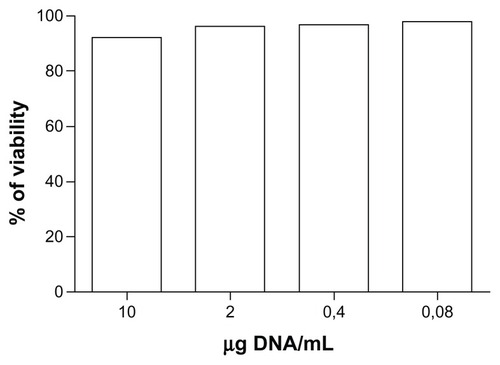
Figure 7 Effect of ultrasound on COS7 viability.
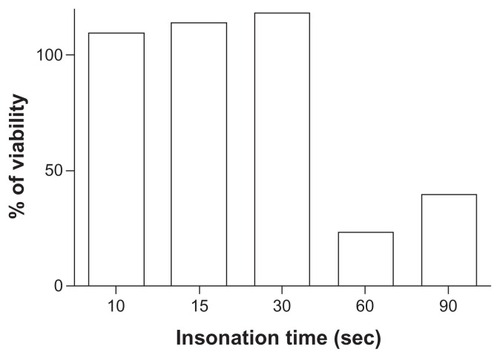
Figure 8 COS7 viability assay after incubation with DNA-loaded chitosan nanobubbles.