Figures & data
Figure 1 Schematic illustration of the fabrication of composite electrospun scaffolds loaded with chitosan-based nanoparticles and nHA.
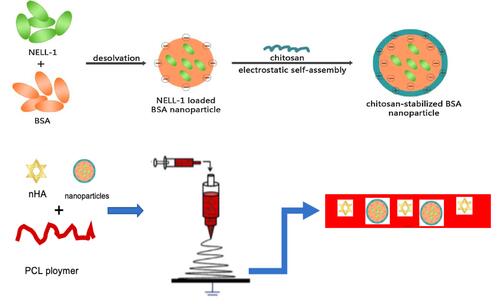
Table 1 Details of Solution Preparation for Electrospinning and Nanoparticles for All Polymers Including Molecular Weight (Mw), Concentration w/w (C), Solvents, Stirring Time (t), The Rotation Speed of Stirrer (Vr), and Temperature of the Hot Plate During Mixing
Figure 2 SEM and TEM images of electrospun fibers with TEM images inserted on the top right in each group.
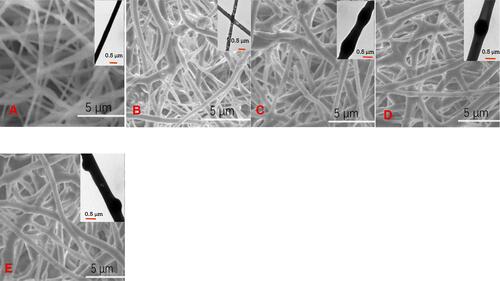
Figure 3 Diameters of electrospinning fiber in different group.
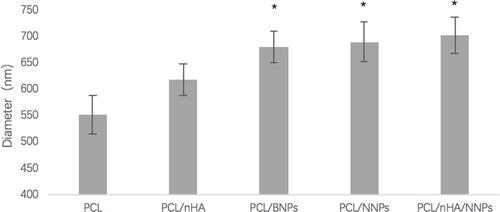
Figure 4 The tensile strength of electrospun fibers in different group.
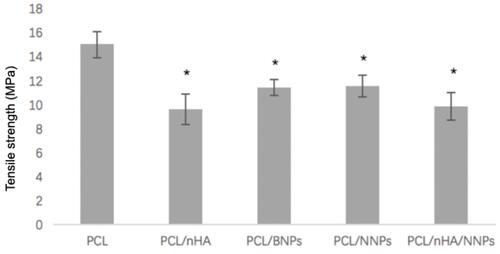
Figure 5 Contact angle of electrospun fibers in different group with images inserted on the top.
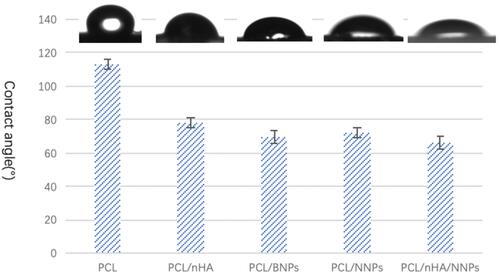
Figure 6 Cumulative release curve of NELL-1 growth factor in different samples.
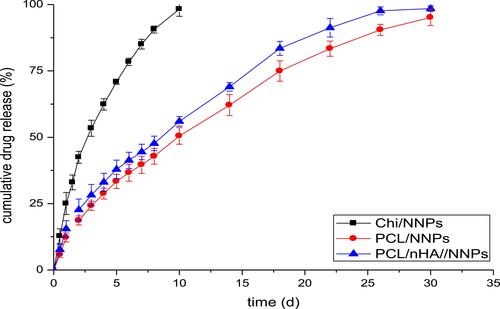
Figure 7 MC3T3-E1 cell adhesion number, MC3T3-E1 cell adhesion morphology (SEM images), actin cytoskeletal organization and nucleus of cells (CLSM images) after incubation with different samples.
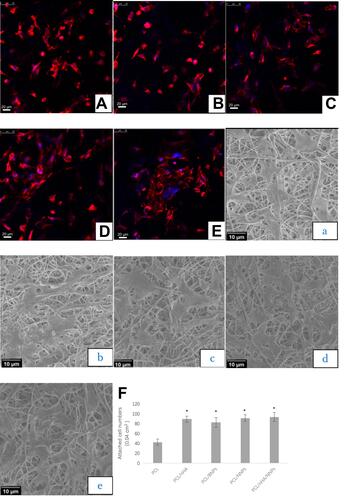
Figure 8 CCK-8 results of MC3T3-E1 cells after incubation with different samples for 1 days, 4 days and 7 days.
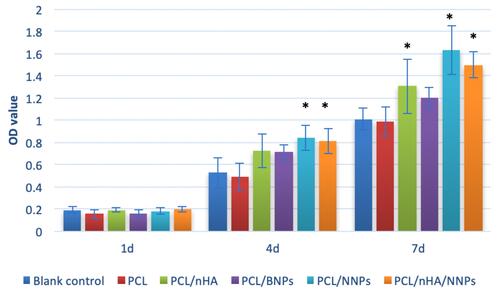
Figure 9 MC3T3-E1 cells ALP activity after cultivating for 7 days, 14 days and 21 days with different samples.
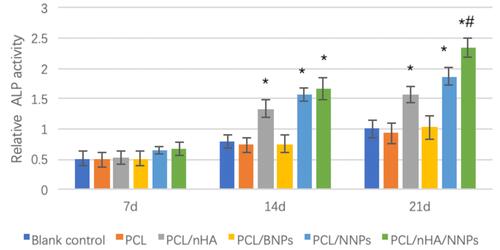
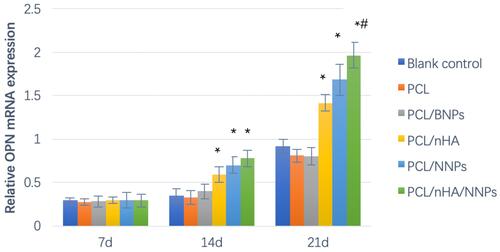
Figure 10 The OPN mRNA expression of MC3T3-E1 cells after incubation with different scaffolds for 7 days, 14 days and 21 days.