Figures & data
Table 1 Dereplicated Metabolites from LC-HRESIMS Analysis of Coscinoderma sp. Crude Extract
Figure 1 LC-HRESIMS chromatogram of the dereplicated metabolites of Coscinoderma sp. (positive).
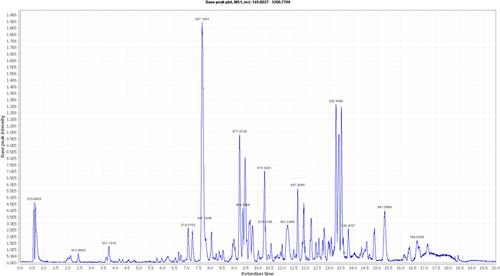
Figure 2 LC-HRESIMS chromatogram of the dereplicated metabolites of Coscinoderma sp. (negative).
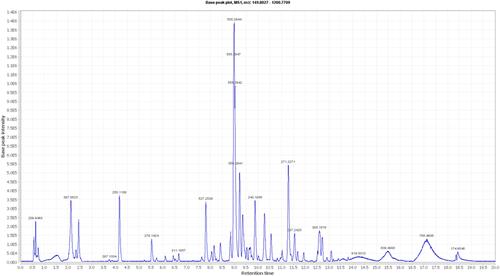
Figure 3 Metabolites putatively identified by LC-HRESIMS analysis of CE. Green metabolites showed the highest scores by PASS-based in silico predictions (anticancer, phosphatase inhibitors, and Pin-1 inhibitors for compounds 3 and 9). Compounds inside blue rectangles were further verified by docking analysis against SHP2. Compounds inside red rectangles were further verified by docking analysis against Pin-1.
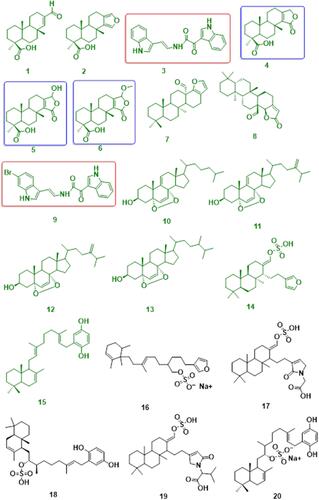
Figure 4 (A) TEM images and size distribution of Coscinoderma sp.-containing liposomes, (B) TEM image of empty liposomes.
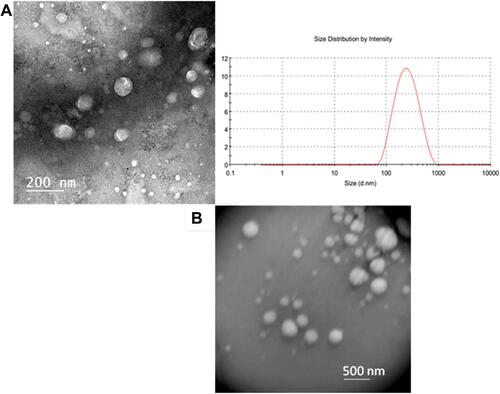
Figure 5 Thermogravimetric analysis (TGA) of empty liposomes, Coscinoderma extract and Coscinoderma liposomes.
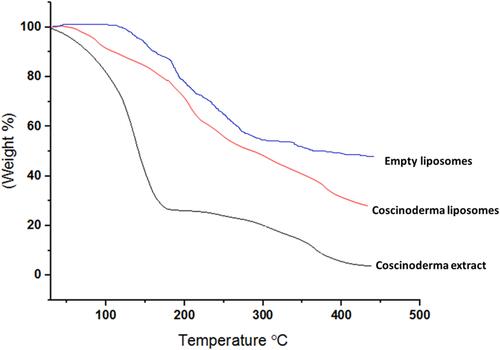
Figure 6 FTIR of empty liposomes, Coscinoderma extract, and Coscinoderma liposomes.
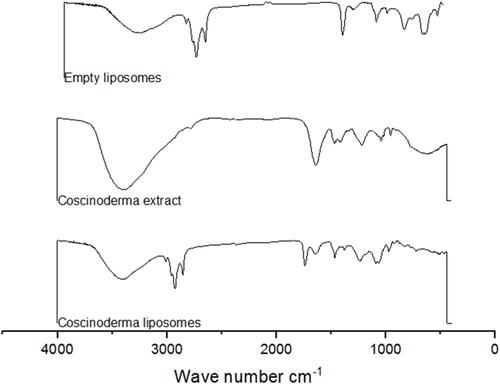
Figure 7 (A) PASS prediction scores of metabolites 1-20. Pa scores >0.5 indicated high-possible experimental activity. Blue columns are for the scores of antiproliferative activity, while the orange columns are for the phosphatase inhibitory activity, and gray columns are for the Pin-1 inhibitory activity. Metabolites 4–6 (assigned by green arrows) showed good binding affinities toward SHP2, while metabolites 3 and 9 (assigned by orange arrows) showed good binding affinities toward Pin-1. (B) Binding affinities of compounds 1–20 against SHP2, PRL-1-3, and Pin-1.
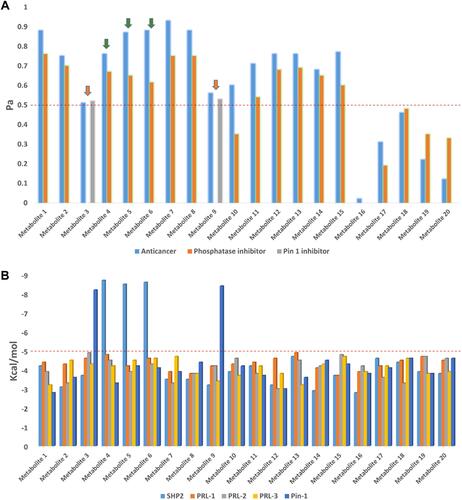
Figure 8 Binding modes of metabolites 4–6 together with the co-crystallized inhibitor (A–D, respectively) inside the binding site of SHP2.
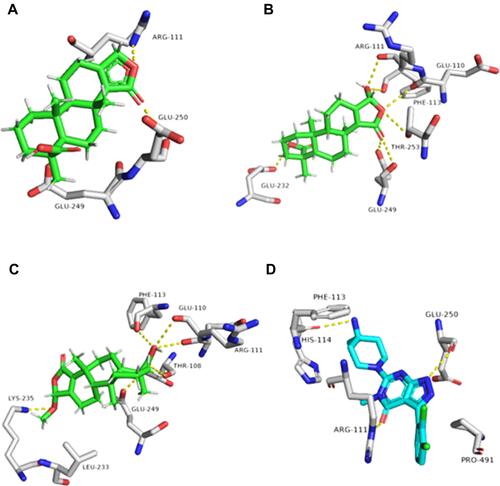
Figure 9 Binding modes of metabolites 3 and 9 together with the co-crystallized inhibitor (A–C, respectively) inside the binding site of Pin-1.
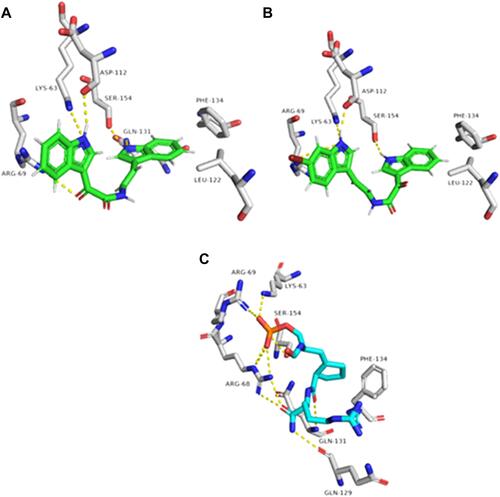
Table 2 In vitro Antiproliferative Activity of Coscinoderma sp. Crude Extract and Its Liposome Form Against HepG2, MCF7, and Caco-2 Cancer Cell Lines, Expressed as IC50 ± (SEM) µg/mL
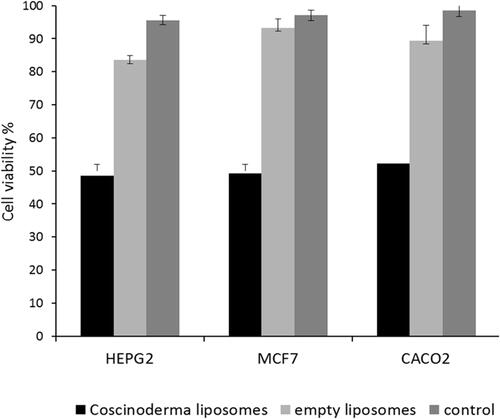
Figure 10 Cell viability of HepG2, MCF7, and Caco-2 cell lines at IC50 of Coscinoderma liposomes and the corresponding empty liposomes.