Figures & data
Figure 1 SEM (A) and TEM (B) images of nanoporous bioglass containing silver, with 0.02 wt% Ag content.
Abbreviations: Ag, silver; SEM, scanning electron microscopy; TEM, transmission electron microscopy.
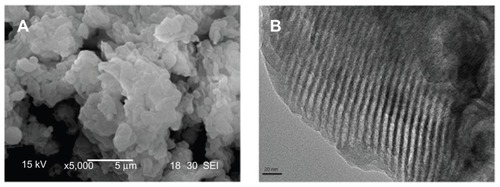
Figure 2 Nitrogen adsorption–desorption isotherms (A) and pore size distribution (B) of nanoporous bioglass containing silver, with 0.02 wt% Ag content.
Abbreviation: Ag, silver.
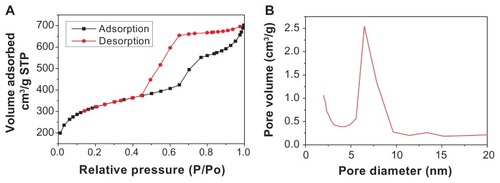
Table 1 Effect of Ag content on surface area and pore size of nanoporous bioglass containing silver
Figure 3 Water adsorption of nanoporous bioglass containing silver (n-BGS), and BGS without nanopores as a control.
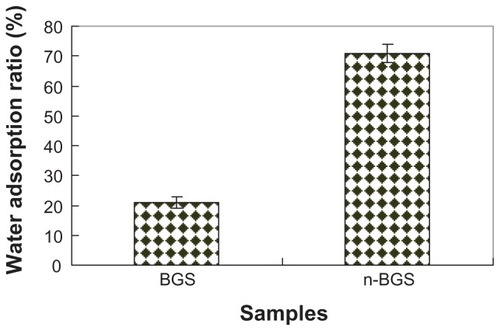
Figure 4 Ag ions release from nanoporous bioglass containing silver (n-BGS), and BGS without nanopores, with 0.02 wt% Ag content into PBS (pH 7.4) over time.
Abbreviations: Ag, silver; BGS, bioglass containing silver; ppm, parts per million.
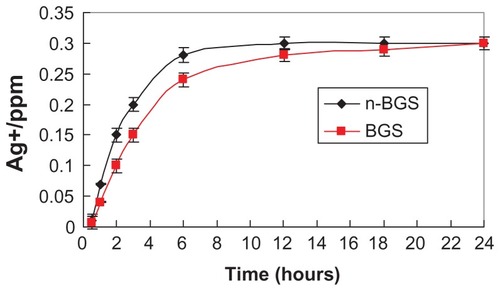
Figure 5 Effects of Ag amounts on antibacterial property of nanoporous bioglass containing silver against Escherichia coli incubation for 1 hour and 12 hours.
Abbreviation: Ag, silver.
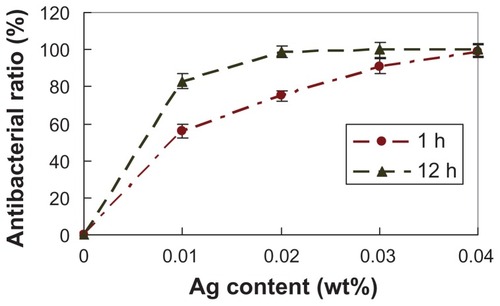
Figure 6 Antibacterial effects of nanoporous bioglass containing silver (n-BGS) against Escherichia coli at 12 hours (A), and non-nanoporous BGS (B) as a control.
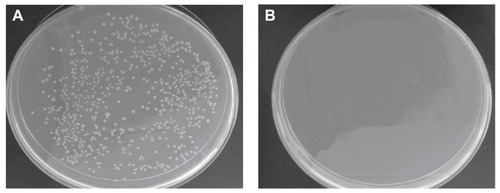
Figure 7 Effects of bioglass containing silver extracts on L929 cells cultured for 24 hours, which showed the cytotoxicity of nanoporous bioglass containing silver.
Abbreviation: OD, optical density.
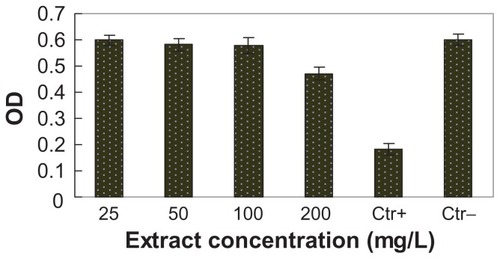
Figure 8 Clotting time of the nanoporous bioglass containing silver (n-BGS) and non-nanoporous BGS measured using the prothrombin time (PT) and activated partial thromboplastin time (APTT) assays, and without material as a control.
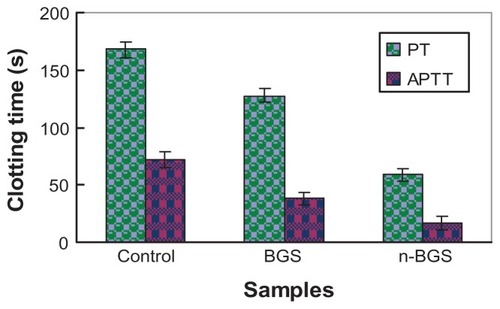
Figure 9 Comparison of hemostasis in rabbit skin injury (control wound bleeding): nanoporous bioglass containing silver (n-BGS) (A) and non-nanoporous BGS (B).
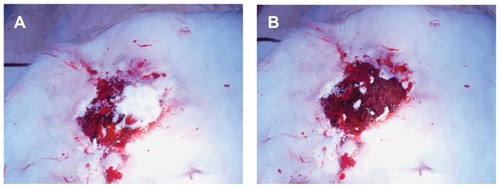
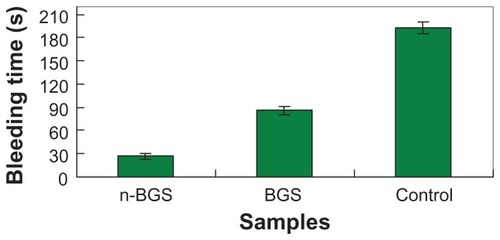
Figure 10 Comparison of the bleeding time of rabbit skin injury after using nanoporous bioglass containing silver (n-BGS), non-nanoporous BGS, and without material (control).